


Bitcoin (BTCUSD) Suddenly Goes down 1.13% on Sep 14: What You Need to Watch
Bitcoin (BTCUSD) is down 1.13% at Sep 14 20:30(ET), now at $76442.96, with a 7-day down of 3.49%.
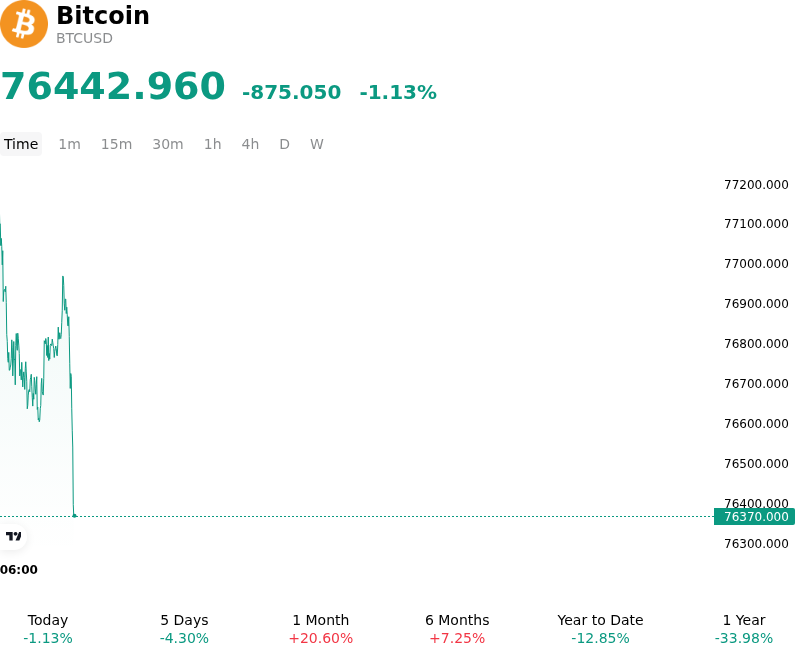
What is driving Bitcoin (BTCUSD)’s stock price down today?
Bitcoin experienced selling pressure primarily driven by hawkish macroeconomic repricing and rising U.S. Treasury yields ahead of the Federal Reserve policy meeting. Hotter-than-expected inflation data reinforced expectations of tighter monetary policy, prompting institutional forecasters to adjust rate outlooks. As Treasury yields climbed and the U.S. dollar gained momentum, the opportunity cost of holding non-yielding digital assets increased, leading global macro allocators to reduce risk asset exposure across portfolios.
Institutional capital flows reflected this cautious stance, as U.S. spot Bitcoin exchange-traded funds recorded net capital outflows after a period of sustained demand. The reduction in net ETF inflows weakened spot liquidity and reduced bid depth across institutional exchanges, leaving price action more vulnerable to overhead supply. Without strong spot buying to absorb market liquidity, price levels drifted downward toward key technical support zones.
Derivatives market positioning further contributed to the downward drift through leverage unwinding. A drop in total open interest and liquidations of leveraged long positions signaled that traders were actively de-risking ahead of high-impact monetary policy decisions and pending regulatory milestones. Muted funding rates across major crypto derivatives venues showed a general lack of aggressive bullish conviction among market participants in the short term.
The current weakness appears to be a macro-driven tactical retreat rather than a structural deterioration of market fundamentals. Near-term price stability will largely depend on upcoming Federal Reserve policy guidance, inflation trends, and whether spot ETF demand can re-establish positive net inflows to absorb broader macro headwinds.
Technical Analysis of Bitcoin (BTCUSD)
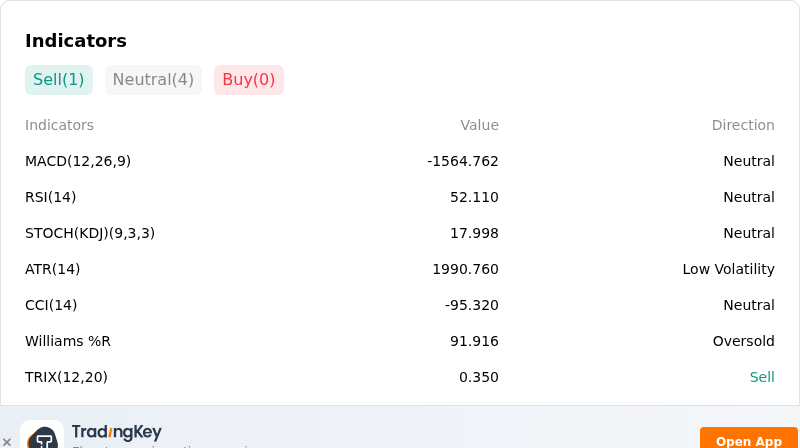
Technically, Bitcoin (BTCUSD) shows a MACD (12,26,9) value of -1564.762, indicating a neutral signal. The RSI at 52.110 suggests neutral condition and the Williams %R at 91.916 suggests oversold condition. Please monitor closely.
More details about Bitcoin (BTCUSD)
Recent Events and Risks:
- Derivatives Leverage Unwind and Long Liquidations: A sudden market pullback triggered over $380 million in crypto futures liquidations—dominated by nearly $270 million in forced long position closures—accelerating downside momentum and putting critical support in the $76,000–$77,000 range under severe stress.
- Sustained Institutional Spot ETF Outflows: U.S. spot Bitcoin exchange-traded funds recorded consecutive daily net outflows exceeding $166 million across major issuers, reflecting a sharp slowdown in institutional buying power and spot market absorption.
- Macroeconomic Hawkishness and Yield Spikes: Hotter-than-expected inflation data and surging U.S. Treasury yields have amplified fears of prolonged Federal Reserve monetary tightening, raising risk-free real yields and driving capital away from non-yielding speculative assets like Bitcoin.
- On-Chain Overhead Supply and Holder Distribution: Persistent profit-taking and supply distribution by long-term holders in the $77,000–$80,000 price range have created a heavy cost-basis wall, stifling upside breakouts and increasing downside vulnerability during low-volume trading sessions.
Recommended Articles


