


NZD/USD (NZDUSD) Volatility Intensified on Sep 2: Factors to Watch
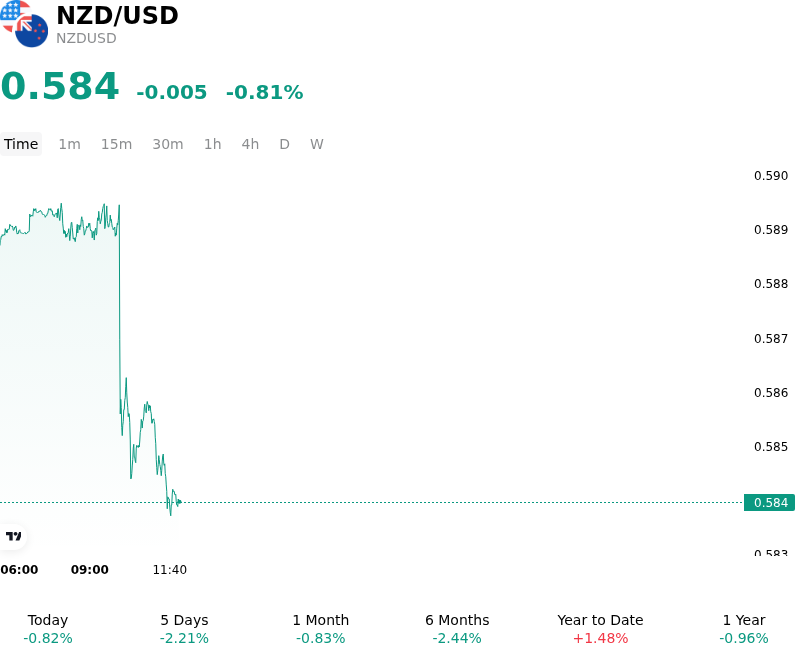
NZD/USD (NZDUSD) is down 0.81% at Sep 2 00:00(ET), now at $0.58408, with a 7-day down of 1.68%.
What is driving NZD/USD (NZDUSD)’s stock price down today?
The sell-off in NZDUSD was primarily driven by a classic buy-the-rumor, sell-the-fact reaction following the Reserve Bank of New Zealand monetary policy decision. Although the RBNZ raised its Official Cash Rate by 25 basis points to 2.75%, the quarter-point increase was fully discounted by financial markets, leaving the currency highly sensitive to the central bank's forward guidance and updated economic projections. The accompanying Monetary Policy Statement disappointed investors who had positioned for a more aggressive tightening path, as policymakers emphasized a cautious and gradual approach to removing monetary stimulus while citing uneven domestic economic recovery and downside growth risks.
Market pricing ahead of the decision had embedded aggressive future rate hikes, reflecting elevated interest rate swap pricing and optimistic rate forecasts. However, the central bank's updated cash rate projections signaled a modest policy trajectory, failing to validate the market's hawkish expectations. Projections indicating only limited additional tightening over the coming quarters triggered a downward repricing of short-term New Zealand interest rate expectations and compressed front-end yield differentials. The monetary policy committee's explicit focus on domestic headwinds, including weak household spending, labor market softness, and sluggish real estate activity, further dampened institutional appetite for the Kiwi dollar.
Relative price dynamics further favored the quote currency as the US dollar maintained a firm stance across major currency pairs. Firming expectations regarding Federal Reserve monetary policy and resilient US economic indicators anchored US Treasury yields, bolstering global demand for greenback liquidity. The combination of a dovish policy repricing from New Zealand central bankers and steady US yield support encouraged tactical capital to unwind long positions in high-beta commodity-linked currencies, driving the exchange rate lower.
Technical Analysis of NZD/USD (NZDUSD)
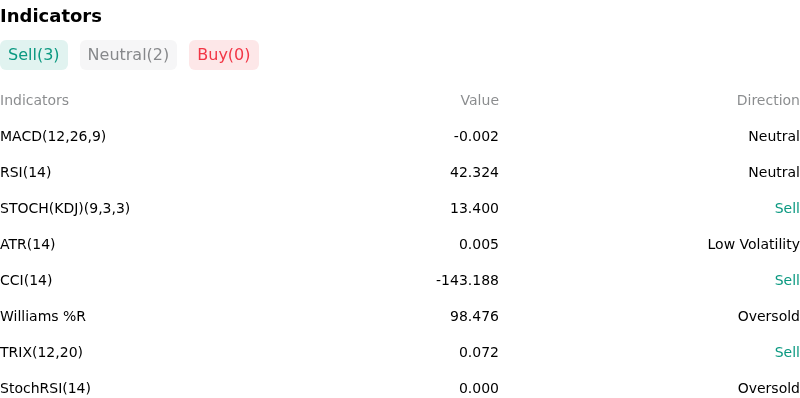
Technically, NZD/USD (NZDUSD) shows a MACD (12,26,9) value of -0.002, indicating a neutral signal. The RSI at 42.324 suggests neutral condition and the Williams %R at 98.476 suggests oversold condition. Please monitor closely.
More details about NZD/USD (NZDUSD)
Recent Events and Risks:
- RBNZ Policy Guidance and Dovish Repricing Risk: Although the Reserve Bank of New Zealand delivered a 25 basis point rate hike to 2.75%, monetary policy commentary highlighting uneven domestic economic activity, soft labor market conditions, and uncertain timing for future hikes threatens to unwind overly hawkish market expectations, pulling NZD/USD lower.
- US Dollar Resurgence and Yield Spread Disadvantage: Resilient US Treasury yields and market repricing for a potentially hawkish Federal Reserve path—supported by persistent US inflation risks—continue to keep the US Dollar firm, maintaining a wide interest rate differential disadvantage against New Zealand yields.
- China Economic Slowdown and Export Headwinds: Ongoing growth sluggishness and fragile industrial momentum in China, New Zealand's largest trading partner, continue to suppress demand for Kiwi agricultural and commodity exports, eroding trade earnings and weighing on currency sentiment.
- Geopolitical Volatility and Risk-Off Capital Flows: Escalating tensions in the Middle East and concerns over energy supply disruptions have curtailed global risk appetite, prompting investors to seek safe-haven asset exposure in USD while triggering selling pressure in risk-sensitive commodity currencies like the NZD.
Recommended Articles


