


Cotton Futures (COTTON-F) Drops on Sep 2: Key Factors to Watch
Cotton Futures (COTTON-F) is down 3.51% at Sep 2 00:00(ET), now at $88.13, with a 7-day down of 0.91%.
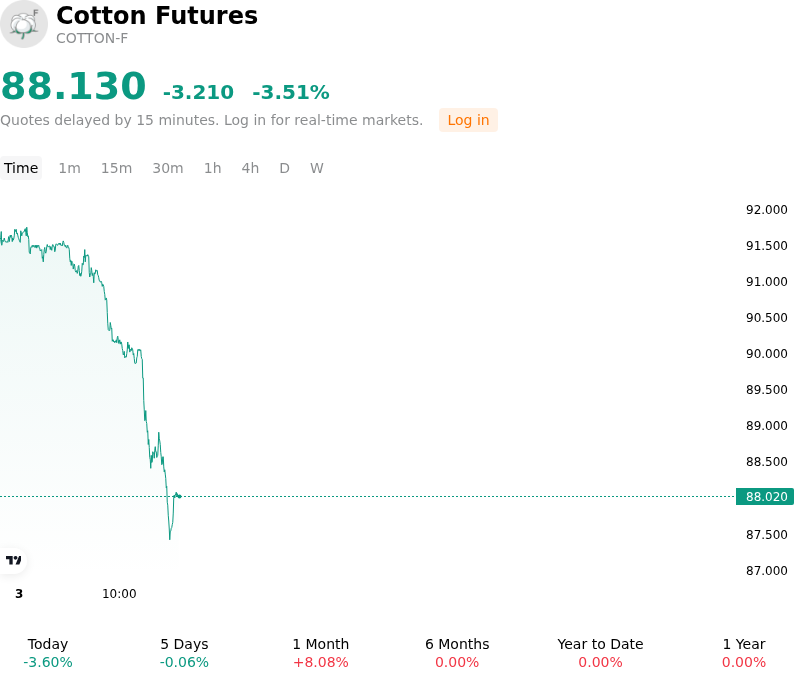
What is driving Cotton Futures (COTTON-F)’s stock price down today?
Cotton futures pulled back as speculative long liquidation and technical profit-taking took hold following an extended multi-week rally that pushed contracts to multi-month highs. After absorbing significant bullish momentum throughout late August due to supply-side risk premiums, market participants moved to trim net-long exposure at the start of the new trading month. The downside movement was further exacerbated by a notable strengthening in the US dollar index, which heightened currency headwinds for dollar-denominated soft commodities and reduced broader investor appetite across agricultural markets.
On the supply side, recent crop condition data indicated a modest stabilization in crop quality, tempering immediate supply-disruption fears. While persistent dryness across key growing zones in the Southwest remains a structural concern, the minor improvement in weekly condition ratings incentivized traders to book profits. Concurrently, seasonal supply pressure is beginning to build as the Northern Hemisphere approaches peak harvest. Accelerated boll opening across major domestic and international growing regions has elevated expectations for incoming physical availability, encouraging producer hedging activity near recent peak price levels and creating strong overhead resistance.
From a demand standpoint, a firming greenback threatens to constrain near-term export competitiveness by making U.S. fiber more expensive for foreign buyers. Although industrial mill consumption and state reserve auctions in Asia have demonstrated steady baseline demand, end-user mill buyers have shown hesitation in chasing prices at multi-month peaks, preferring to purchase on price dips. Overall, the intraday decline appears to represent a technical repricing and seasonal consolidation rather than a fundamental reversal of the underlying supply-demand balance. Market participants will continue to monitor upcoming government balance-sheet revisions, mid-harvest weather developments across key cotton belts, and international trade policy shifts.
Technical Analysis of Cotton Futures (COTTON-F)
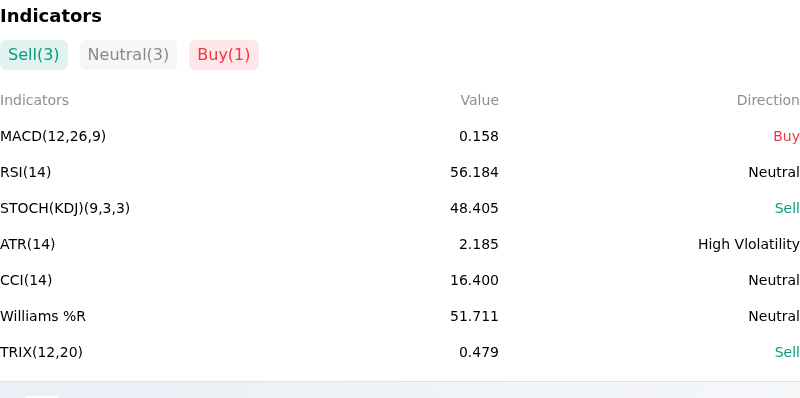
Technically, Cotton Futures (COTTON-F) shows a MACD (12,26,9) value of 0.158, indicating a buy signal. The RSI at 56.184 suggests neutral condition and the Williams %R at 51.711 suggests neutral condition. Please monitor closely.
More details about Cotton Futures (COTTON-F)
Recent Events and Risks:
- Turnaround Profit-Taking and Long Liquidation: ICE cotton futures experienced a sharp intraday pullback of over 130 to 150 points from recent contract highs near 93.74 cents per pound, as overbought technical momentum triggered aggressive long liquidation and profit-taking across front-month contracts.
- Stabilizing U.S. Crop Ratings: The USDA's latest Crop Progress report showed a 2-percentage-point increase in U.S. cotton good-to-excellent condition ratings to 39%, briefly easing extreme supply loss concerns in key growing belts and dampening near-term weather risk premiums.
- U.S. Dollar Gains and Currency Headwinds: A firming U.S. Dollar Index has raised purchasing costs for overseas textile mills, creating currency-driven pressure on U.S. export competitiveness while cumulative 2026/27 export commitments continue to lag the historical five-year pace.
- Global Demand Friction and Brazilian Competition: Lingering tariff uncertainties with major Asian mill buyers combined with expanding market share from South American competitors, particularly Brazil, continue to cap international demand for U.S. fiber and increase risks of domestic stock accumulation.
Recommended Articles


