


Newmont Corporation Stock (NEM) Closed Down by 3.57% on Aug 18: Key Drivers Unveiled
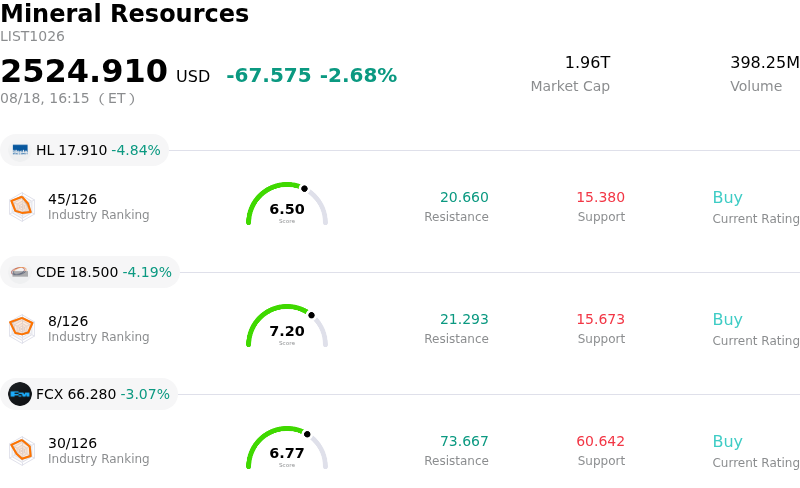
Newmont Corporation (NEM) closed down by 3.57%. The Mineral Resources sector is down by 2.68%. The company underperformed the industry. Top 3 stocks by turnover in the sector: Hecla Mining Co (HL) down 4.84%; Coeur Mining Inc (CDE) down 4.19%; Freeport-McMoRan Inc (FCX) down 3.07%.
What is driving Newmont Corporation (NEM)’s stock price down today?
Newmont Corporation experienced downward equity pressure during intraday trading, primarily driven by softness across the precious metals market. Spot gold prices retreated below key technical levels as elevated U.S. Treasury yields and firming interest rate expectations weighed on non-yielding assets. Higher bond yields increase the opportunity cost of holding gold, creating a sector-wide headwind for senior miners like Newmont whose earnings remain heavily tied to spot metal prices.
The decline also reflects profit-taking following a substantial multi-week rally. Technical momentum metrics had recently entered overbought territory after the stock advanced rapidly in early August, fueled by robust second-quarter cash generation and the resolution of long-standing corporate disputes. Following this prolonged period of outperformance relative to the broader market, institutional and retail investors engaged in profit-locking, contributing to heightened intraday price swings.
Beyond macroeconomic drivers, investors continue to digest key operational considerations. The company recently agreed to a major joint-venture restructuring with Barrick Mining regarding Nevada Gold Mines, which entails a significant cash payment to consolidate core assets. Additionally, corporate disclosures indicating executive insider share sales under pre-arranged trading plans in recent weeks have maintained a tone of market caution. With management guidance highlighting that capital expenditures will be heavily weighted toward the second half of the year, market participants are closely monitoring potential near-term pressure on operating margins.
Technical Analysis of Newmont Corporation (NEM)
Technically, Newmont Corporation (NEM) shows a MACD (12,26,9) value of 4.576, indicating a buy signal. The RSI at 73.077 suggests buy condition and the Williams %R at 3.300 suggests overbought condition. Please monitor closely.
Media Coverage of Newmont Corporation (NEM)
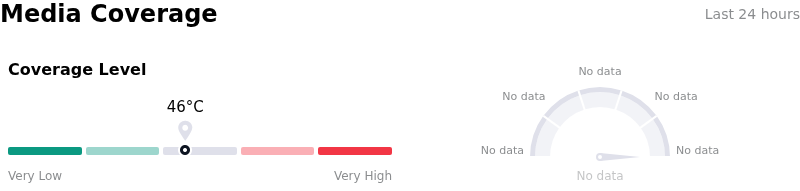
In terms of media coverage, Newmont Corporation (NEM) shows a coverage score of 46, indicating a moderate level of media attention. The overall market sentiment index is currently in extremely bullish zone.
Fundamental Analysis of Newmont Corporation (NEM)
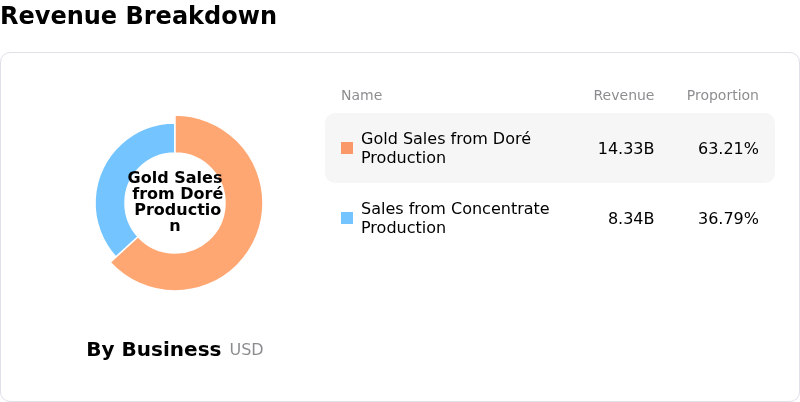
Newmont Corporation (NEM) is in the Mineral Resources industry. Its latest annual revenue is $22.67B, ranking 8 in the industry. The net profit is $7.08B, ranking 3 in the industry. Company Profile
Over the past month, multiple analysts have rated the company as Buy, with an average price target of $133.45, a high of $205.00, and a low of $64.32.
More details about Newmont Corporation (NEM)
Company Specific Risks:
- Substantial Cash Outflow from Joint Venture Settlement: Under the expanded Nevada Gold Mines joint venture agreement, Newmont committed $1.95 billion in cash payments to Barrick Mining to integrate excluded properties, creating a heavy near-term liquidity burden and elevating joint-venture execution risk.
- Operating Cost Inflation and AISC Escalation: Persistent All-In Sustaining Cost (AISC) inflation, which surged 22% year-over-year to $1,938 per ounce due to elevated labor, diesel, and maintenance expenditures, threatens to erode operating margins into the third quarter.
- Consensus Earnings Downgrades and Lower Production Output: Wall Street consensus Q3 2026 EPS estimates were revised down from $2.19 to $1.92 following management forecasts of lower full-year attributable gold production, projected at 5.26 million ounces compared to 5.89 million ounces in 2025.
- Coordinated Executive Insider Stock Sales: SEC Form 4 filings revealed significant insider share liquidations by senior leadership, including Chief Financial Officer Brian Tabolt reducing his direct equity holding by 28%, introducing market supply pressure and signaling insider caution.
Recommended Articles


