


Interactive Brokers Group Inc Stock (IBKR) Moved Down by 3.92% on Aug 18: Drivers Behind the Movement
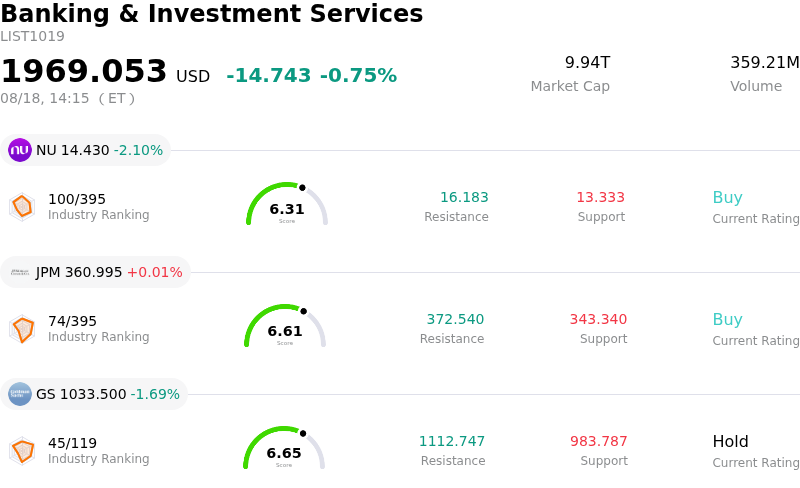
Interactive Brokers Group Inc (IBKR) moved down by 3.92%. The Banking & Investment Services sector is down by 0.75%. The company underperformed the industry. Top 3 stocks by turnover in the sector: Nu Holdings Ltd (NU) down 2.10%; JPMorgan Chase & Co (JPM) up 0.01%; Goldman Sachs Group Inc (GS) down 1.69%.
What is driving Interactive Brokers Group Inc (IBKR)’s stock price down today?
Interactive Brokers Group experienced downside momentum as profit-taking swept through the electronic brokerage sector following a powerful rally over recent months. Having significantly outperformed the broader financial industry with strong multi-month gains, IBKR's premium valuation—trading at a forward earnings multiple well above the industry average—left the stock sensitive to broad market retrenchments. With technical indicators signaling short-term overbought conditions after recent highs, institutional and retail investors locked in gains, triggering intraday volatility and downside price pressure.
Underlying macro headwinds and shifts in interest rate expectations also weighed on investor sentiment. As a global electronic broker that derives a substantial portion of its net revenue from interest income on client margin loans and uninvested cash balances, IBKR is particularly sensitive to fluctuations in benchmark yields and central bank monetary policy. Recent macroeconomic data and shifting expectations regarding future Federal Reserve policy decisions have fueled volatility in Treasury yields. Uncertainty surrounding net interest margin sustainability in an evolving rate environment prompted cautious repositioning among institutional market participants.
Furthermore, while the firm continues to report solid underlying business drivers, including steady account growth and expanded international venue connectivity, monthly performance metrics highlighted a natural mid-summer moderation in daily average revenue trades relative to earlier peak periods. Seasonal trading slowdowns combined with general equity market choppy trading caused high-beta financial technology and brokerage names to underperform. Market participants continue to weigh IBKR's operational expansion against macro rate sensitivity to assess whether the move represents temporary consolidation within a broader growth trend.
Technical Analysis of Interactive Brokers Group Inc (IBKR)
Technically, Interactive Brokers Group Inc (IBKR) shows a MACD (12,26,9) value of 1.020, indicating a neutral signal. The RSI at 58.155 suggests neutral condition and the Williams %R at 2.925 suggests overbought condition. Please monitor closely.
Media Coverage of Interactive Brokers Group Inc (IBKR)
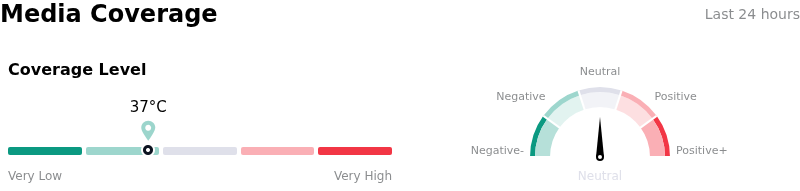
In terms of media coverage, Interactive Brokers Group Inc (IBKR) shows a coverage score of 37, indicating a low level of media attention. The overall market sentiment index is currently in neutral zone.
Fundamental Analysis of Interactive Brokers Group Inc (IBKR)
Interactive Brokers Group Inc (IBKR) is in the Banking & Investment Services industry. Its latest annual revenue is $10.00B, ranking 24 in the industry. The net profit is $984.00M, ranking 24 in the industry. Company Profile
Over the past month, multiple analysts have rated the company as Buy, with an average price target of $106.31, a high of $121.00, and a low of $72.18.
More details about Interactive Brokers Group Inc (IBKR)
Company Specific Risks:
- Interest Rate & Net Interest Income Exposure: Company sensitivity models project that each 25-basis-point interest rate cut by central banks reduces annual net interest income by approximately $108 million, posing a direct threat to high-margin interest revenues as global central banks shift toward monetary easing.
- Sequential Deceleration in Monthly Metrics: Latest operational reporting highlights near-term softening in trading activity, with July Daily Average Revenue Trades (DARTs) dropping 16% sequentially to 4.426 million alongside a 7% month-over-month decline in client margin loan balances.
- Technical Support Breakdown: Recent trading sessions saw IBKR fall over 3.5% as the stock broke below critical short-term moving averages, triggering automated sell signals and exacerbating downside technical momentum toward support levels around $87.
- Elevated Valuation Multiple Vulnerability: Operating at a rich valuation of roughly 33x to 34x forward earnings, the stock faces heightened multiple compression risk if transaction volume growth slows down or if regulatory transaction fees continue to inflate execution costs.
Recommended Articles


