


Amphenol Corp Stock (APH) Moved Down by 7.19% on Aug 18: Key Drivers Unveiled
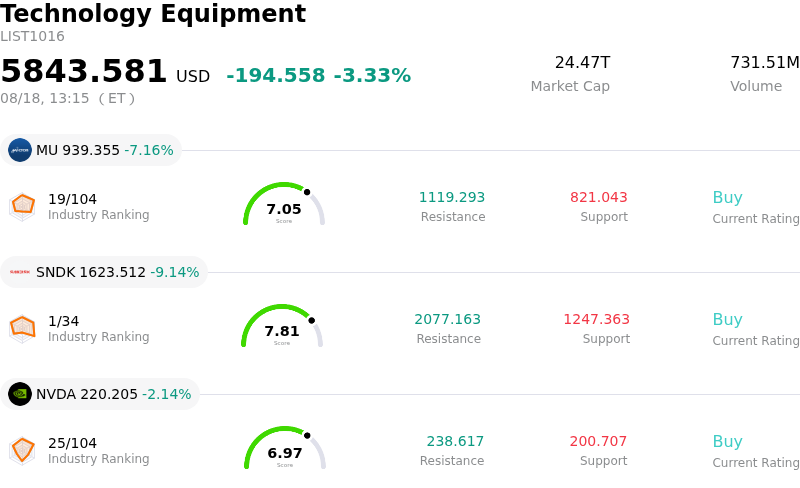
Amphenol Corp (APH) moved down by 7.19%. The Technology Equipment sector is down by 3.33%. The company underperformed the industry. Top 3 stocks by turnover in the sector: Micron Technology Inc (MU) down 7.16%; SanDisk Corporation (SNDK) down 9.05%; NVIDIA Corp (NVDA) down 2.14%.
What is driving Amphenol Corp (APH)’s stock price down today?
The pullback in Amphenol Corporation equity price is primarily driven by profit-taking following a powerful post-earnings rally and short-term positioning adjustments tied to the company capital return schedule. Amphenol recently reported exceptional second-quarter financial results featuring strong organic revenue growth powered by booming artificial intelligence infrastructure demand across its IT datacom segment. However, after pushing shares close to multi-year highs and expanding the company price-to-earnings valuation well above its sector peers, the elevated valuation created an environment highly susceptible to aggressive profit-taking from institutional investors.
Market mechanics also played a critical role in today intraday volatility. The decline closely follows the record date for the company previously announced two-for-one stock split. Following the passing of the record date, temporary liquidity shifts and position rebalancing frequently occur as short-term traders and systematic funds lock in gains prior to the distribution of new shares in early September. This technical unwinding of momentum trades amplified selling pressure throughout the session, overriding fundamental optimism surrounding recent dividend approvals and share buyback execution.
From a broader macro and industry perspective, market sentiment toward hardware interconnect suppliers has grown increasingly sensitive to capital spending cycles among hyperscaler data center operators. While Amphenol record order book and high book-to-bill ratio demonstrate robust demand for high-speed copper and fiber optic interconnects, investors remain watchful of elevated capital intensity and potential demand normalization. The convergence of premium valuation multiples, technical position unwinding after the stock split record date, and broader profit-taking across tech supply chain names drove the notable downside pressure observed today.
Technical Analysis of Amphenol Corp (APH)
Technically, Amphenol Corp (APH) shows a MACD (12,26,9) value of 1.051, indicating a buy signal. The RSI at 59.914 suggests neutral condition and the Williams %R at 20.290 suggests buy condition. Please monitor closely.
Fundamental Analysis of Amphenol Corp (APH)
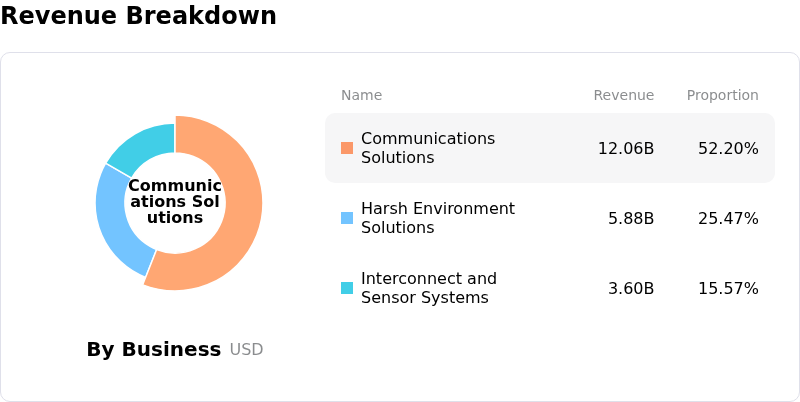
Amphenol Corp (APH) is in the Technology Equipment industry. Its latest annual revenue is $23.09B, ranking 4 in the industry. The net profit is $4.27B, ranking 1 in the industry. Company Profile
Over the past month, multiple analysts have rated the company as Buy, with an average price target of $190.81, a high of $230.00, and a low of $105.00.
More details about Amphenol Corp (APH)
Company Specific Risks:
- Elevated Valuation Premium and Multiple Compression Vulnerability: Amphenol trades at an elevated forward P/E ratio of approximately 28x, representing a significant premium over peers in the electronic equipment sector. This rich valuation leaves the stock exposed to sudden intraday pullbacks and multiple compression if growth in AI infrastructure spending fails to exceed high market expectations.
- Substantial Insider Equity Dispositions: Recent SEC Form 4 and Form 144 filings disclose heavy insider selling, including Executive Vice President Lance D'Amico disposing of 50,000 shares for $8.1 million and CFO Craig Lampo liquidating 193,200 option-exercised shares for over $32 million. Total insider sales exceeding $170 million over 90 days create supply overhang concerns and weigh on institutional investor sentiment.
- High Capital Intensity and Tech Demand Normalization: Accelerating capital expenditures and R&D investments required for next-generation AI data centers and optical connectivity place sustained pressure on cash flows. The heightened reinvestment rate creates operational risk should hyperscaler demand pull forward or normalize sooner than anticipated.
- Technical Deterioration and Near-Term Volatility: Recent technical indicators—including an Aroon indicator downward crossover and an overbought signal following a breach of the upper Bollinger Band—have triggered short-term sell signals. This momentum fatigue, coupled with price adjustments surrounding the upcoming 2-for-1 stock split execution, increases intraday volatility.
Recommended Articles


