


Nebius Group NV Stock (NBIS) Moved Up by 8.13% on Aug 14: A Full Analysis
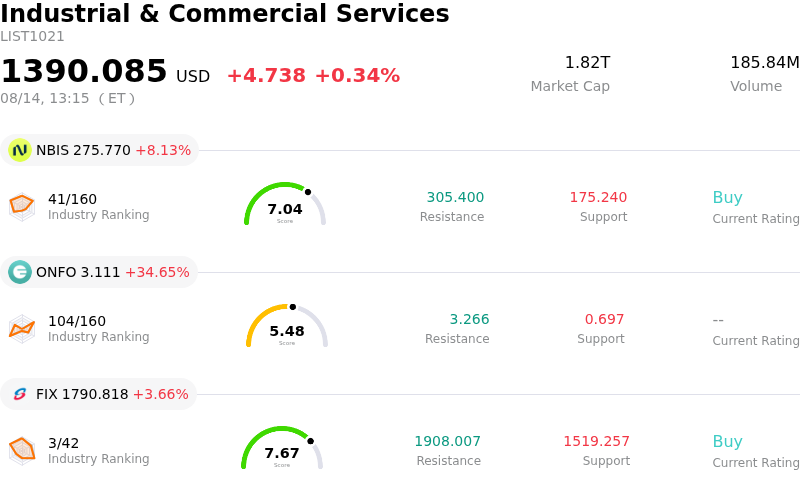
Nebius Group NV (NBIS) moved up by 8.13%. The Industrial & Commercial Services sector is up by 0.34%. The company outperformed the industry. Top 3 stocks by turnover in the sector: Nebius Group NV (NBIS) up 8.13%; Onfolio Holdings Inc (ONFO) up 34.65%; Comfort Systems USA Inc (FIX) up 3.66%.
What is driving Nebius Group NV (NBIS)’s stock price up today?
Nebius Group experienced significant upward price momentum accompanied by heightened intraday volatility, primarily driven by the market's continued digestion of its exceptional second-quarter financial results and broader tailwinds across the artificial intelligence cloud sector. The company reported massive year-over-year revenue expansion, powered by explosive growth in its core AI cloud division and a surging annualized revenue run-rate. Additionally, profitability metrics showed sharp improvement, with adjusted EBITDA margins reaching robust levels alongside billions in expected customer prepayments. This operational strength reinforced investor confidence in the company's ability to monetize expanding compute capacity.
The upward movement was further supported by favorable sector dynamics and constructive Wall Street commentary regarding AI infrastructure providers. Research notes from major investment brokerages highlighted favorable pricing trends for AI data centers, driven by aggressive capital expenditure plans from technology giants and shortening payback periods for GPU infrastructure. Analysts responded by reiterating positive ratings and raising price targets, emphasizing Nebius's expanding power pipeline, long-term commercial contracts, and strategic positioning to capture growing enterprise demand for high-performance computing.
However, the trading session was marked by noticeable intraday volatility as contrasting market forces clashed. High trading volumes, active momentum trading, and short position adjustments created wide intraday price swings. While some institutional investors took profits following the multi-day rally, aggressive short covering and retail buying power absorbed selling pressure, driving the stock higher overall. Although elevated capital expenditure requirements and long-term funding needs remain key risk factors, market sentiment remains anchored by Nebius's rapid top-line scaling and market share gains in the neocloud space.
Technical Analysis of Nebius Group NV (NBIS)
Technically, Nebius Group NV (NBIS) shows a MACD (12,26,9) value of 14.860, indicating a neutral signal. The RSI at 60.828 suggests neutral condition and the Williams %R at 16.073 suggests overbought condition. Please monitor closely.
Fundamental Analysis of Nebius Group NV (NBIS)
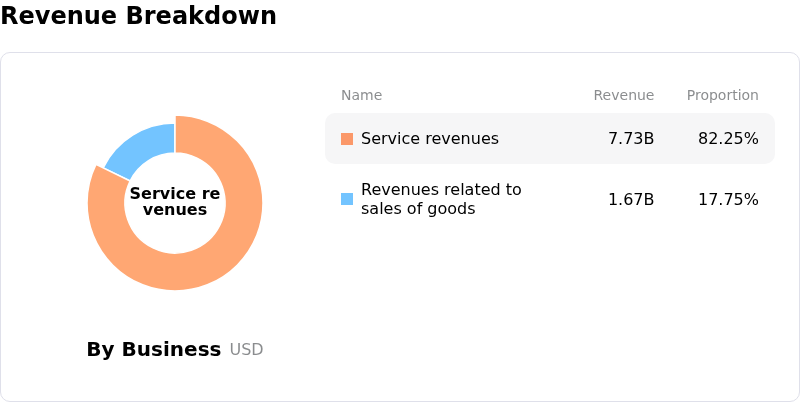
Nebius Group NV (NBIS) is in the Industrial & Commercial Services industry. Its latest annual revenue is $529.80M, ranking 113 in the industry. The net profit is $82.50M, ranking 73 in the industry. Company Profile
Over the past month, multiple analysts have rated the company as Buy, with an average price target of $251.22, a high of $410.00, and a low of $78.34.
More details about Nebius Group NV (NBIS)
Company Specific Risks:
- Short-Seller Scrutiny and Accounting Adjustments: Prominent short-seller Michael Burry expanded a short position against Nebius following its Q2 2026 earnings report, publicly criticizing the company for extending its server hardware depreciation schedule from four years to five years to soften paper losses despite rapid market depreciation on short-term AI compute access.
- High Capex Requirements and Continued Net Losses: In its August 12 Form 6-K filing, Nebius reported a quarterly operating loss of $175.9 million and a net loss from continuing operations of $190.4 million, underscoring severe cash flow pressure as quarterly capital expenditures for GPU infrastructure and data center construction exceeded $5.7 billion funded largely through debt and convertible notes.
- Facility Execution Delays and Analyst Caution: D.A. Davidson reiterated a Neutral rating with a sub-market $175 price target, highlighting material execution risks and operational delays at Nebius's Vineland data center facility that could restrict capacity scaling.
- Extreme Valuation Metrics and Persistent Insider Sales: Trading at a Price-to-Sales ratio above 50x, the stock faces downside pressure from stretched valuations while recent SEC filings disclose significant insider stock disinvestments—including executive Rule 10b5-1 sales—with zero insider purchases over the past quarter.
Recommended Articles


