


USD/CAD Price Forecast: Bears target the 200-day SMA
- USD/CAD deepens its decline below 1.4000 and heads for a third straight weekly loss.
- The technical picture remains bearish, with the 200-day SMA emerging as the next key downside test.
- Momentum indicators suggest the recent decline may be overstretched.
USD/CAD extends its decline farther below 1.4000 on Friday and heads for a third consecutive weekly loss. At the time of writing, the pair trades around 1.3877, at levels last seen in early July.
The recent strength in the Canadian Dollar (CAD) is driven by broad US Dollar (USD) weakness and relatively stronger Canadian economic data, while elevated Oil prices provide underlying support to the commodity-linked Loonie.
Monetary policy expectations remain in focus. In the US, moderating inflation, weaker consumer spending and signs of labour market softness have lowered the chances of a Federal Reserve (Fed) interest rate hike next month. Across the border, next week’s Consumer Price Index (CPI) report will provide a fresh update on inflation and its possible impact on the Bank of Canada’s (BoC) policy path.
BoC seen prioritising soft core inflation as output gap closes only gradually
According to TD Securities, the Bank of Canada is likely to place greater emphasis on the “softer trajectory for core inflation” at its 2 September decision, noting that the limited “passthrough from higher oil prices gives it more scope to continue looking through the energy shock.” The bank adds that the “recent deceleration across core inflation measures also helps to validate the Bank's assessment around excess supply and capacity to absorb stronger growth amid the rebound in Q2 GDP tracking.”
In TD’s view, this backdrop “should allow the Bank of Canada to stick to its recent messaging next month, with a focus on softer underlying inflation and the gradual timeline to close the output gap.”
Technical analysis
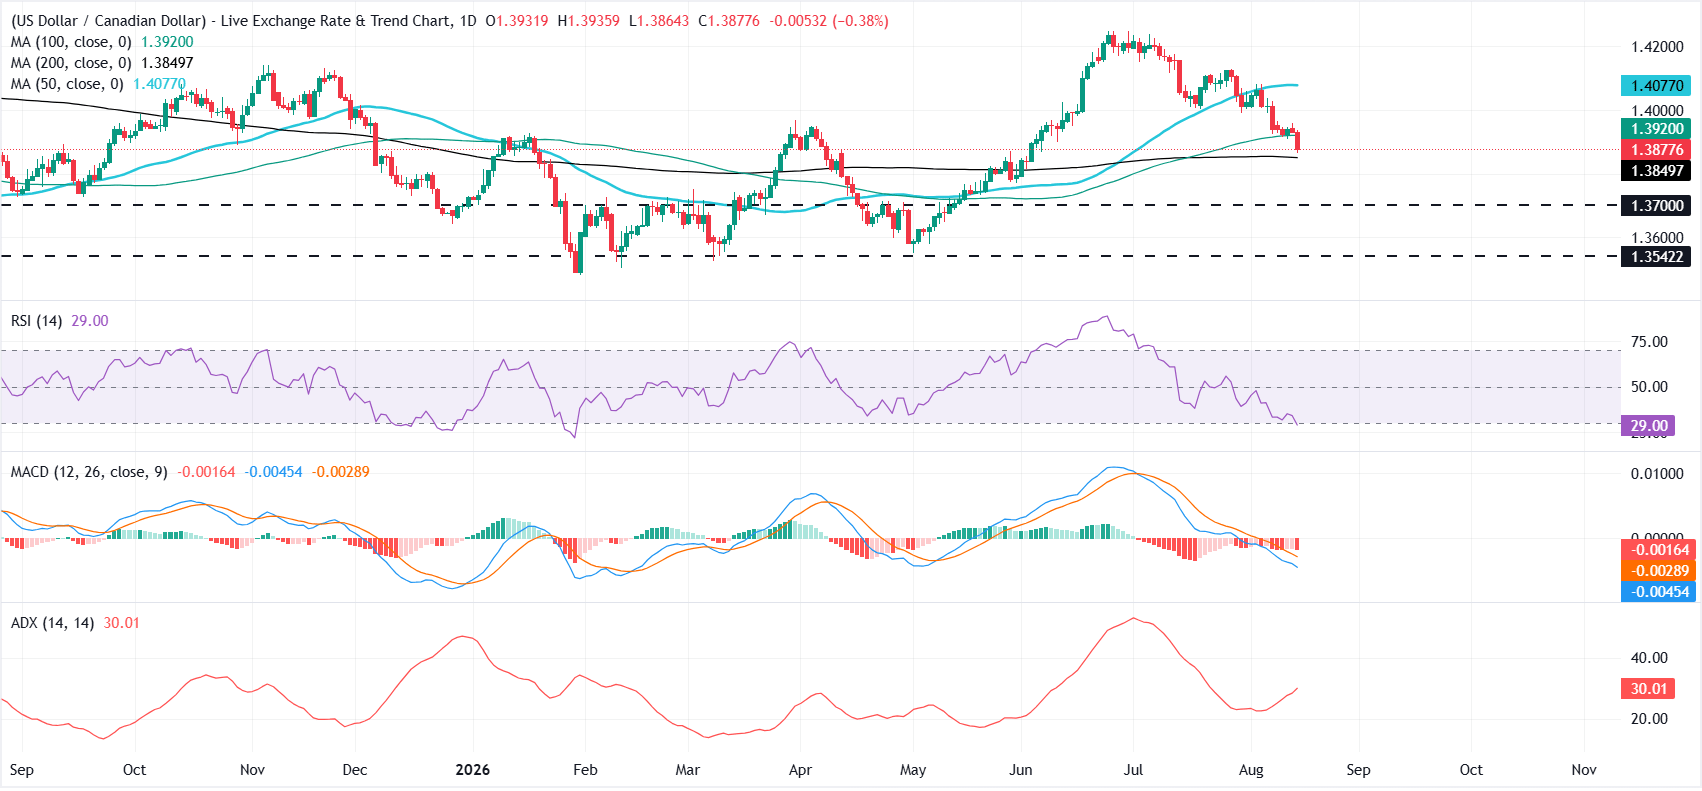
From a technical perspective, USD/CAD maintains a steady downtrend, forming a series of lower highs and lower lows since reversing from above 1.4200 in late June. The pair subsequently slipped below the 50-day Simple Moving Average (SMA), while the latest leg lower has pushed it beneath the 100-day SMA.
The Relative Strength Index (14) around 29 signals oversold conditions and warns that downside momentum may be stretched even as the Moving Average Convergence Divergence (MACD) remains in negative territory.
On the downside, immediate support is aligned with the 200-day SMA close to 1.3850, ahead of a more substantial horizontal floor at 1.3700, with a deeper bearish extension exposing the structural level at 1.3542.
On the topside, a recovery attempt would first face resistance at the 100-day SMA at 1.3920, with any stronger rebound likely capped by the higher 50-day SMA at 1.4077 unless sellers lose control of the medium-term trend.
(The technical analysis of this story was written with the help of an AI tool. Know more.)
US Dollar Price Today
The table below shows the percentage change of US Dollar (USD) against listed major currencies today. US Dollar was the strongest against the Japanese Yen.
| USD | EUR | GBP | JPY | CAD | AUD | NZD | CHF | |
|---|---|---|---|---|---|---|---|---|
| USD | -0.31% | -0.35% | -0.08% | -0.39% | -0.29% | -0.59% | -0.14% | |
| EUR | 0.31% | -0.04% | 0.22% | -0.10% | 0.02% | -0.30% | 0.17% | |
| GBP | 0.35% | 0.04% | 0.28% | -0.08% | 0.06% | -0.24% | 0.22% | |
| JPY | 0.08% | -0.22% | -0.28% | -0.30% | -0.21% | -0.54% | -0.04% | |
| CAD | 0.39% | 0.10% | 0.08% | 0.30% | 0.10% | -0.20% | 0.26% | |
| AUD | 0.29% | -0.02% | -0.06% | 0.21% | -0.10% | -0.30% | 0.16% | |
| NZD | 0.59% | 0.30% | 0.24% | 0.54% | 0.20% | 0.30% | 0.48% | |
| CHF | 0.14% | -0.17% | -0.22% | 0.04% | -0.26% | -0.16% | -0.48% |
The heat map shows percentage changes of major currencies against each other. The base currency is picked from the left column, while the quote currency is picked from the top row. For example, if you pick the US Dollar from the left column and move along the horizontal line to the Japanese Yen, the percentage change displayed in the box will represent USD (base)/JPY (quote).
Recommended Articles


