


Applied Materials Inc Stock (AMAT) Opened Up by 4.13% on Aug 12: Key Drivers Unveiled
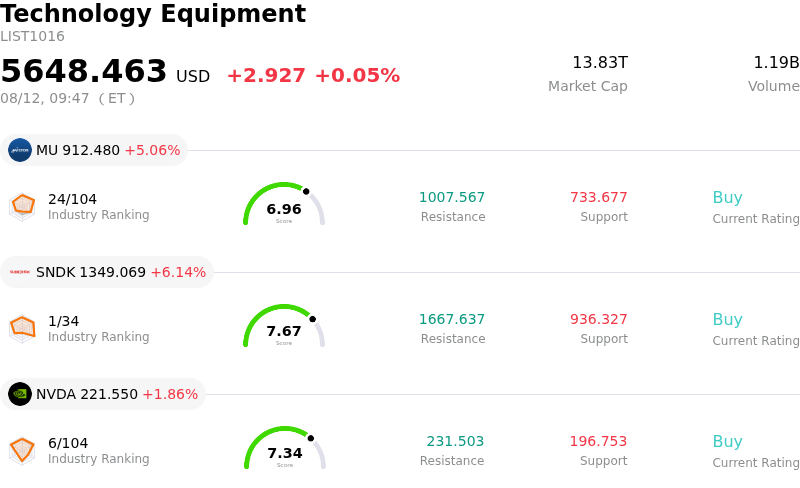
Applied Materials Inc (AMAT) opened up by 4.13%. The Technology Equipment sector is up by 0.05%. The company outperformed the industry. Top 3 stocks by turnover in the sector: Micron Technology Inc (MU) up 4.72%; SanDisk Corporation (SNDK) up 6.14%; NVIDIA Corp (NVDA) up 1.86%.
What is driving Applied Materials Inc (AMAT)’s stock price up today?
Applied Materials experienced strong upward momentum accompanied by heightened intraday volatility as market participants actively built positions ahead of the company's fiscal third-quarter earnings announcement scheduled for the following day. Sentiment across the semiconductor equipment sector was bolstered by persistent demand for artificial intelligence infrastructure hardware, which continues to drive accelerated capital expenditure from leading chipmakers and foundry operators. Expectations for the upcoming financial report remain demanding, with consensus estimates pointing to robust year-over-year top-line growth and expanded earnings per share underpinned by cleanroom expansions and equipment pull-ins.
The intraday buying was further supported by optimistic commentary from Wall Street analysts and recent upward revisions to future fiscal forecasts. Exposure to high-bandwidth memory, advanced packaging architectures, and leading-edge Gate-All-Around logic transistors positions the company at the center of critical supply chain bottlenecks in high-performance computing. Management's constructive full-year outlook for wafer fabrication equipment spending has reassured investors that elevated capital allocation toward next-generation memory and logic capacity remains durable.
Additionally, ongoing corporate developments, including capital return commitments through dividends and expanded research collaborations, provided a solid operational backdrop. While high market expectations and historical price volatility surrounding major reporting events contributed to sharp price swings throughout the session, aggressive accumulation by buyers eager to capitalize on long-term AI hardware tailwinds ultimately dominated trading activity.
Technical Analysis of Applied Materials Inc (AMAT)
Technically, Applied Materials Inc (AMAT) shows a MACD (12,26,9) value of 3.348, indicating a neutral signal. The RSI at 48.015 suggests neutral condition and the Williams %R at 36.301 suggests buy condition. Please monitor closely.
Media Coverage of Applied Materials Inc (AMAT)
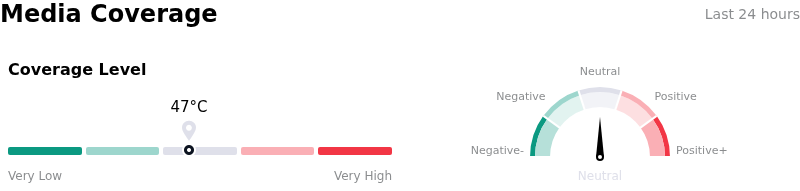
In terms of media coverage, Applied Materials Inc (AMAT) shows a coverage score of 47, indicating a moderate level of media attention. The overall market sentiment index is currently in neutral zone.
Fundamental Analysis of Applied Materials Inc (AMAT)
Applied Materials Inc (AMAT) is in the Technology Equipment industry. Its latest annual revenue is $28.37B, ranking 11 in the industry. The net profit is $7.00B, ranking 8 in the industry. Company Profile
Over the past month, multiple analysts have rated the company as Buy, with an average price target of $626.10, a high of $900.00, and a low of $308.00.
More details about Applied Materials Inc (AMAT)
Company Specific Risks:
- Analyst Downgrades and Valuation Premium: Wall Street firms, including Erste Group, have downgraded AMAT to Hold ahead of its August 13 earnings report, citing valuation multiples near 49x P/E and sluggish revenue growth relative to semiconductor equipment peers, creating severe downside sensitivity if quarterly results or guidance miss elevated market expectations.
- China Export Controls and Regulatory Compliance: Strict U.S. technology export restrictions continue to constrain forward order visibility in key Asian markets, while ongoing compliance mandates from a $252.5 million Department of Commerce settlement over historical unauthorized equipment shipments to SMIC keep geopolitical and operational risks elevated.
- Substantial Insider Share Liquidation: Significant executive share unloading totaling approximately $169.7 million over recent months has eroded market sentiment and triggered institutional concern regarding internal confidence in valuation sustainability.
- Technical Breakdown and Pre-Earnings Unwinding: AMAT shares have suffered a 17.4% decline over the last 30 days and technical moving-average breakdowns, accelerating systematic sell-offs and intraday volatility as investors de-risk positions ahead of the October quarter outlook.
Recommended Articles


