


Bitcoin (BTCUSD) Is up 1.05% on Aug 12: What Do On-Chain Data and Market Sentiment Show?
Bitcoin (BTCUSD) is up 1.05% at Aug 12 08:30(ET), now at $64382, with a 7-day down of 0.65%.
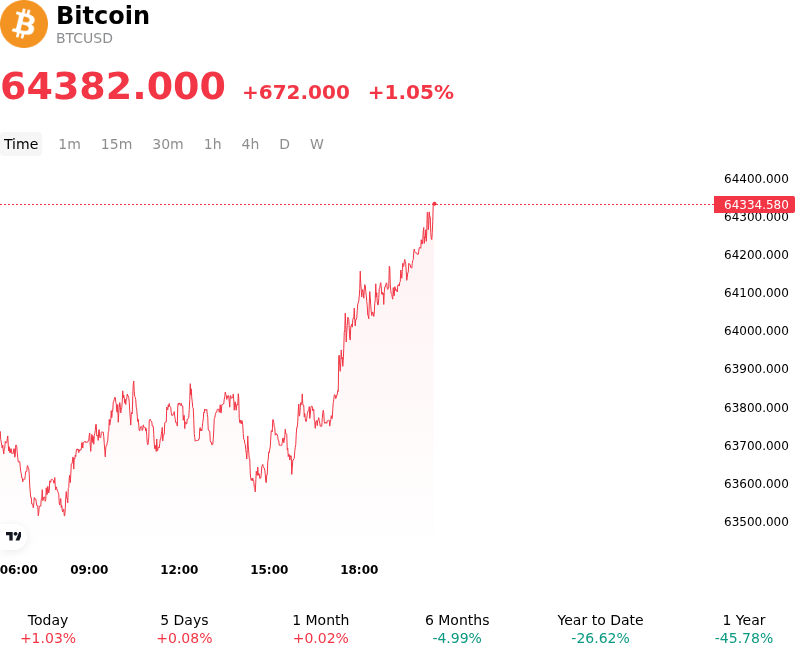
What is driving Bitcoin (BTCUSD)’s stock price up today?
Bitcoin advanced as macroeconomic liquidity conditions improved and institutional capital flows accelerated following key U.S. inflation data. The release of the July Consumer Price Index report helped ease market concerns regarding prolonged monetary tightness, driving a pullback in benchmark U.S. Treasury yields and softening the U.S. Dollar Index. A lower real-yield environment reduced the opportunity cost of holding non-yielding digital assets, prompting macro traders to price in a more favorable liquidity backdrop and recalibrate expectations for Federal Reserve monetary policy.
Institutional participation through spot Bitcoin ETF products provided substantial buying pressure, reinforcing the broader upward trajectory. Net inflows across major ETF issuers absorbed spot market order-book depth, signaling sustained demand from wealth management platforms and institutional allocators. This structural supply absorption continues to tighten liquid exchange reserves, making the asset increasingly responsive to incremental capital inflows. Institutional investors increasingly treat Bitcoin as a dual-purpose asset, serving both as a high-beta proxy for expanding global fiat liquidity and a long-term store of value.
Derivatives positioning played a critical role in accelerating the move. Heading into the macroeconomic data release, elevated open interest in perpetual futures and a short-heavy positioning skew created conditions for a liquidity squeeze. As spot prices broke above key short-term resistance levels, sequential buy-stops and short liquidations added momentum to the rally. Simultaneously, rising open interest in CME Bitcoin futures and an expanding calendar basis pointed to institutional long accumulation rather than purely retail-driven speculative leverage.
On-chain metrics corroborated the constructive market structure, with steady net outflows from centralized exchanges into long-term custody and resilient holder retention rates. While investors remain attentive to prospective regulatory developments and upcoming central bank communication, the confluence of easing macro financial conditions, robust spot ETF inflows, and favorable derivatives dynamics catalyzed capital allocation into Bitcoin.
Technical Analysis of Bitcoin (BTCUSD)
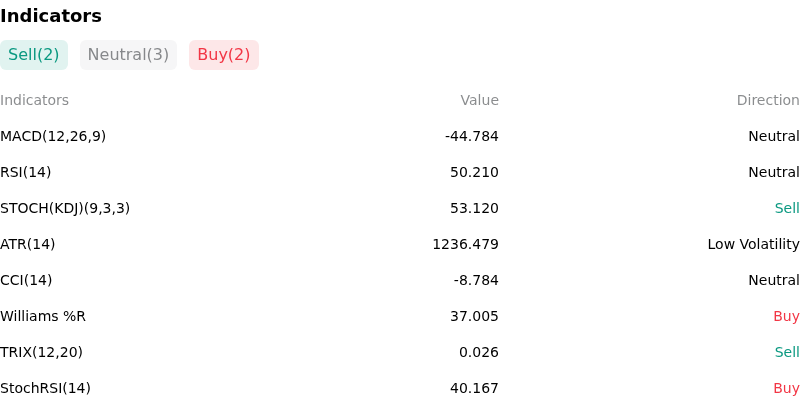
Technically, Bitcoin (BTCUSD) shows a MACD (12,26,9) value of -44.784, indicating a neutral signal. The RSI at 50.210 suggests neutral condition and the Williams %R at 37.005 suggests buy condition. Please monitor closely.
More details about Bitcoin (BTCUSD)
Recent Events and Risks:
- Spot ETF Inflow Disruption: U.S. spot Bitcoin ETFs experienced a sharp $144.67 million net outflow on August 10, snapping a seven-day positive accumulation streak following heavy redemptions across major funds. Despite minor stabilization on August 11, muted institutional net buying signals fragmented demand and leaves price action vulnerable to spot liquidations.
- On-Chain Reserve Accumulation and LTH Distribution: On-chain data indicates that Bitcoin exchange reserves surged to over 2.725 million BTC as of August 11, reaching multi-week highs. Simultaneously, long-term holder (LTH) accumulation has weakened while LTH distribution persists, pointing to elevated overhead supply and capitulation risk around the $63,000–$64,000 zone.
- Macro Risk Reduction Ahead of Inflation Data: Risk-off sentiment ahead of the U.S. Consumer Price Index (CPI) release, coupled with rising Treasury yields, dragged Bitcoin down toward $64,000. Derivatives flow shows an increased concentration of downside put options targeted between $62,000 and $63,000, confirming that market participants are actively hedging against near-term volatility.
- U.S. Regulatory Stalemate: The U.S. Senate failed to muster the required votes to advance the Digital Asset Market Clarity Act before going into recess, causing prediction market passage odds for 2026 to plunge below 20%. The delay in comprehensive crypto market structure legislation removes a key positive catalyst, leaving the asset exposed to macro headwinds.
Recommended Articles


