


Natural Gas (NATGAS) Surges on Aug 12: Key Factors to Watch
Natural Gas (NATGAS) is up 2.07% at Aug 12 01:40(ET), now at $2.814, with a 7-day up of 5.39%.
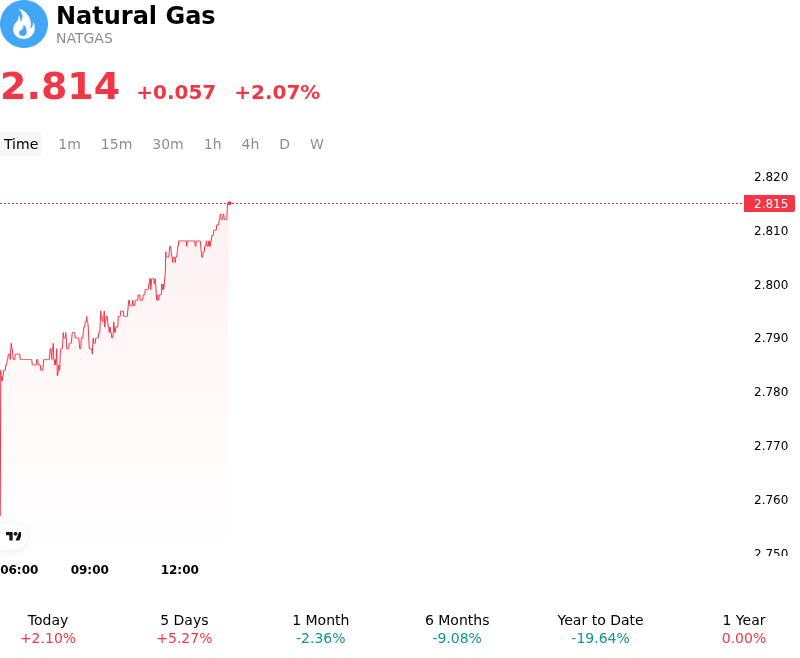
What is driving Natural Gas (NATGAS)’s stock price up today?
The upward momentum in benchmark natural gas futures was primarily propelled by updated weather models pointing to expanded heatwaves across major U.S. demand centers. Elevated cooling demand boosted power-burn estimates as utility providers increased natural gas generation to handle heavy air-conditioning loads. At the same time, feedgas intake at U.S. liquefied natural gas export terminals rebounded as seasonal maintenance cycles concluded, drawing larger volumes away from domestic storage and into export channels.
This tightening of near-term market balances triggered a pronounced short-covering rally across institutional accounts. Aggressive short positioning accumulated by speculative funds over previous weeks left the market vulnerable to upside surprises, where a turn in weather forecasts forced money managers to rapidly buy back short contracts. The resulting liquidity squeeze accelerated buying flows as prices breached key technical resistance thresholds.
Despite the intraday strength, broader market fundamentals present a complex backdrop. High domestic dry gas production rates and above-average total underground storage inventories relative to the five-year mean continue to impose a cap on sustained long-term rallies. Investors are closely evaluating whether late-summer heat and strong export demand can sufficiently slow weekly storage injection rates before the winter withdrawal season begins. Market participants remain focused on upcoming storage inventory reports, tropical weather developments in the Gulf of Mexico, and shoulder-season temperature trends to assess the durability of current price levels.
Technical Analysis of Natural Gas (NATGAS)
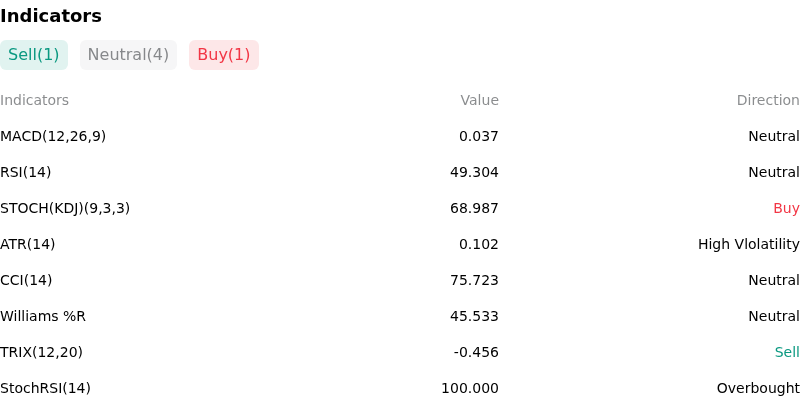
Technically, Natural Gas (NATGAS) shows a MACD (12,26,9) value of 0.037, indicating a neutral signal. The RSI at 49.304 suggests neutral condition and the Williams %R at 45.533 suggests neutral condition. Please monitor closely.
More details about Natural Gas (NATGAS)
Recent Events and Risks:
- Elevated Storage Inventories and Surplus Projections: U.S. natural gas storage levels remain elevated at 6.7% above their five-year seasonal average, while EIA projections forecast end-of-October stockpiles swelling to 3,985 Bcf (5% above the five-year norm), creating a persistent supply overhang that caps upside price momentum.
- Expanding Lower-48 Production and Infrastructure Capacity: U.S. dry gas production continues to hold near elevated levels of 112 Bcf/day (+2.3% year-over-year), while Energy Transfer announced full 1.5 Bcf/day operations on the Hugh Brinson pipeline by September 1, boosting Permian Basin flows directly into the Henry Hub benchmark.
- Weather Model Volatility and Heat-Driven Demand Reversals: Recent price gains driven by peak August heat waves remain exposed to downside volatility, as any moderation in weather forecast models or early transition into autumn temperatures rapidly diminishes power-sector cooling demand.
- Extreme Speculative Positioning and Liquidation Vulnerability: CFTC data revealed money managers recently built near-record net-short positioning in Henry Hub futures, creating heightened intraday volatility as violent short-covering rallies encounter structural oversupply and profit-taking selling pressure.
Recommended Articles


