


Wheat Futures (WHEAT-F) Surges on Aug 12: What Lie behind the Move?
Wheat Futures (WHEAT-F) is up 2.02% at Aug 12 01:30(ET), now at $641.98, with a 7-day up of 0.08%.
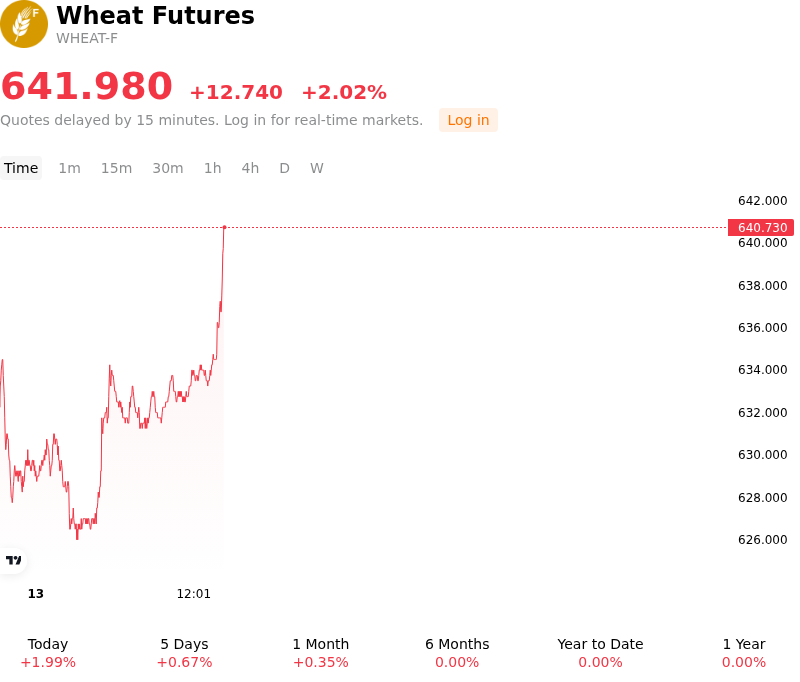
What is driving Wheat Futures (WHEAT-F)’s stock price up today?
Wheat futures moved higher as global supply expectations tightened around the release of the U.S. Department of Agriculture's August World Agricultural Supply and Demand Estimates report. Market participants repriced lower production forecasts for domestic crops, driven by adverse hot and dry weather across key growing regions in the U.S. Northern Plains. Expectations for reduced production and shrinking carryout stocks provided immediate upward momentum, triggering buy-side interest as traders adjusted balance sheet models.
Supply-side developments in key overseas exporting regions further reinforced the upward trajectory. Ongoing geopolitical friction and targeting of port infrastructure in the Black Sea region significantly impaired grain logistics, prompting downgrades to Ukrainian export capacity. Concurrently, Russian export estimates faced downward revisions as harvest delays and maritime shipping disruptions in critical waterways limited spot market availability. These structural shipping bottlenecks have restricted global export flows, heightening supply concerns for key importing regions in North Africa and the Middle East.
Global production expectations were additionally constrained by crop downgrades across the European Union. Prolonged summer heatwaves and persistent drought conditions in core growing areas, particularly France and Germany, led to reduced yield expectations and lower soft wheat export forecasts. With several major exporting nations simultaneously facing supply disruptions or yield hits, global inventory buffer projections have tightened, shifting the broader market balance toward deficit risk.
From a technical and market structure perspective, the price advance was accelerated by institutional short covering and position reallocation following a period of pre-report risk reduction. While movements in the U.S. dollar and broader macroeconomic sentiment provided a neutral-to-supportive backdrop, fundamental supply dynamics served as the primary catalyst. Institutional investors remain focused on Northern Hemisphere harvest finalization, spring wheat yields, and updates on Black Sea corridor logistics.
Technical Analysis of Wheat Futures (WHEAT-F)
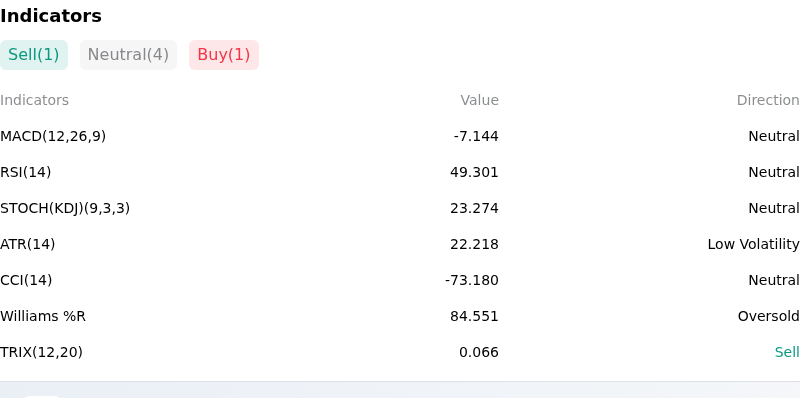
Technically, Wheat Futures (WHEAT-F) shows a MACD (12,26,9) value of -7.144, indicating a neutral signal. The RSI at 49.301 suggests neutral condition and the Williams %R at 84.551 suggests oversold condition. Please monitor closely.
More details about Wheat Futures (WHEAT-F)
Recent Events and Risks:
- Weak Export Pace and Foreign Price Competition: U.S. weekly export inspection data confirms marketing year wheat shipments are trailing more than 24% behind last year's pace. Slower international demand and aggressive, lower-priced export offers from Russian sellers are dampening demand for U.S. originations and putting downside pressure on CBOT wheat contracts.
- Erosion of Black Sea Geopolitical Risk Premium: Intraday price rallies driven by Black Sea shipping concerns have rapidly faded as the market absorbs news of alternative logistics routes established by Ukraine and Russia. Reports of progress in regional shipping negotiations are prompting traders to strip war risk premium out of active futures contracts.
- Seasonal Harvest Pressure and Supply Inflow: Seasonal harvest progress has reached 91% completion for U.S. winter wheat while spring wheat harvesting advanced to 24%—running ahead of the 5-year average pace. This rapid inflow of newly harvested grain into commercial storage facilities is increasing cash market supply and weighing on near-term price momentum.
- Pre-WASDE Speculative De-risking and Contract Unwinding: Ahead of the USDA August WASDE report, speculative accounts and money managers have been actively shedding long positions and executing contract rolls. This reduction in open interest and preemptive liquidation ahead of updated global supply-and-demand figures has added intraday downside volatility.
Recommended Articles


