


Silver (XAGUSD) Is down 2.02% on Aug 11: Key Drivers to Watch
Silver (XAGUSD) is down 2.02% at Aug 11 02:35(ET), now at $64.302, with a 7-day up of 8.26%.
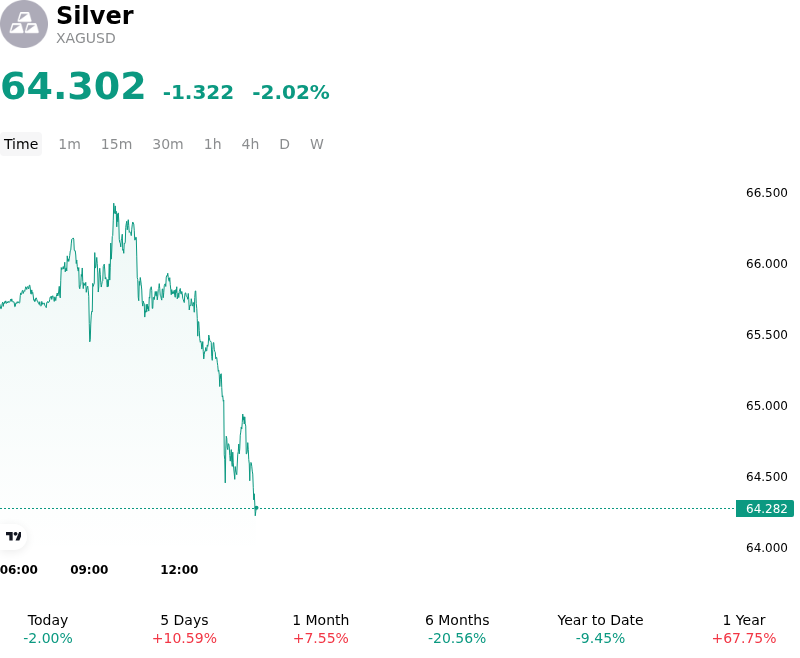
What is driving Silver (XAGUSD)’s stock price down today?
Silver prices faced significant downward pressure during the session as a recalibration of interest rate expectations bolstered the U.S. dollar and pushed real yields higher. The primary catalyst was an unexpected shift in Federal Reserve policy guidance, where hawkish commentary suggested that restrictive monetary conditions would persist longer than the market had previously discounted. As silver is a non-interest-bearing asset, the sharp rise in the opportunity cost of holding the metal led to immediate institutional outflows, particularly from exchange-traded products and speculative long positions.
The strength of the U.S. dollar acted as a further headwind, making silver more expensive for international buyers and triggering technical selling as key support levels were breached. Unlike gold, silver’s dual role as both a monetary and industrial metal left it more vulnerable to a simultaneous shift in risk sentiment and macro expectations. Reports indicating a softening in global manufacturing activity, specifically within the electronics and green energy infrastructure sectors in Asia, raised concerns about the durability of industrial demand for the current quarter.
From a supply-demand perspective, the market is currently navigating a period where stable mine output is meeting a softening spot market in the industrial sector. The lack of immediate physical supply disruptions allowed the bearish macro narrative to dominate price action. Institutional positioning, which had been heavily skewed toward the long side in anticipation of a policy pivot, saw a rapid unwinding as the narrative shifted toward prolonged restrictive conditions. The liquidation of these positions exacerbated the downward move as stop-loss orders were triggered at critical technical thresholds.
Investors remain focused on the trajectory of U.S. real interest rates and upcoming manufacturing PMI data. While long-term structural demand driven by the energy transition remains a supportive underlying factor, the current price action reflects a market highly sensitive to short-term liquidity shifts and the strengthening of the greenback. The breach of recent price floors suggests that silver will require a clear cooling of U.S. inflationary pressures or a softening of the dollar to stabilize and regain its recent momentum.
Technical Analysis of Silver (XAGUSD)
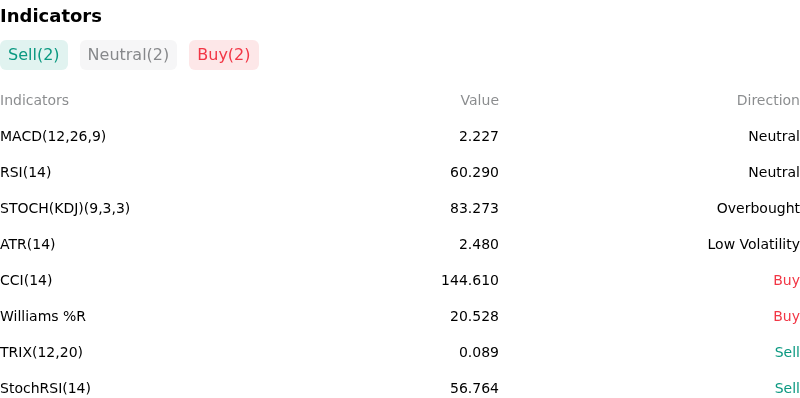
Technically, Silver (XAGUSD) shows a MACD (12,26,9) value of 2.227, indicating a neutral signal. The RSI at 60.290 suggests neutral condition and the Williams %R at 20.528 suggests buy condition. Please monitor closely.
More details about Silver (XAGUSD)
Recent Events and Risks:
- Monetary Policy and US Dollar Strength: Recent hawkish rhetoric from Federal Reserve officials and an uptick in inflation expectations—compounded by geopolitical tensions in the Strait of Hormuz—have propelled US Treasury yields higher, increasing the opportunity cost of holding non-yielding silver and exerting immediate downward pressure on XAGUSD.
- Chinese Industrial Demand Deterioration: Reports over the last 72 hours highlighting persistent weakness in China's property sector and cooling manufacturing sentiment have intensified concerns regarding a slowdown in physical silver consumption, specifically within the photovoltaic and semiconductor manufacturing chains that anchor industrial demand.
- Base Metal Correlation and Inventory Surges: Rising inventory builds in LME-registered copper warehouses have triggered a broader sell-off across the industrial metals complex; silver, which maintains a high positive correlation with copper, is facing derivative pressure as industrial sentiment sours.
- Technical Overextension and CTA Liquidation: With the Relative Strength Index (RSI) hitting overbought territory above 73 and prices failing to sustain a breakout above the $63.00 psychological resistance level, the market faces heightened risk of a long-position squeeze and automated stop-loss selling by trend-following (CTA) funds.
Recommended Articles


