


Silver/AUD (XAGAUD) Volatility Intensified on Aug 11: What to Watch
Silver/AUD (XAGAUD) is down 2.05% at Aug 11 02:30(ET), now at $91.185, with a 7-day up of 8.00%.
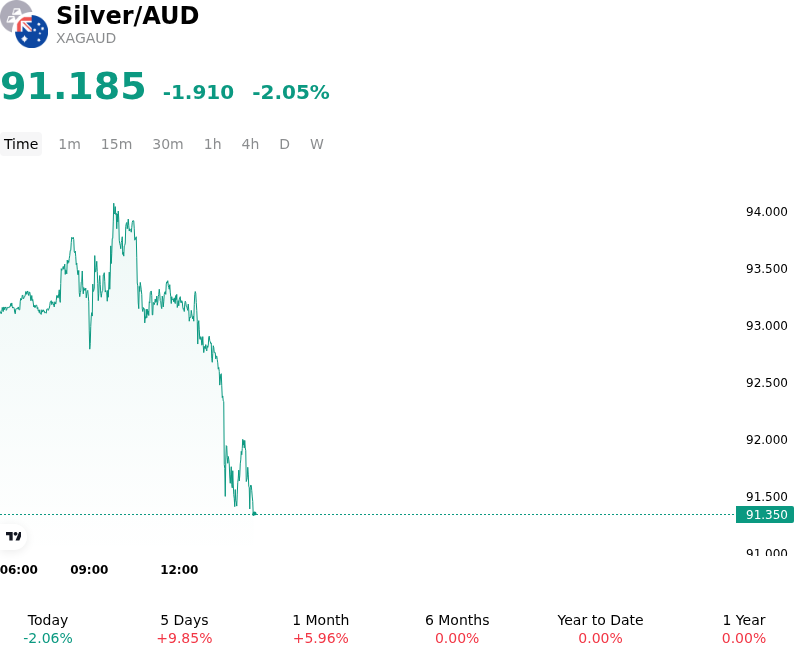
What is driving Silver/AUD (XAGAUD)’s stock price down today?
The sharp retracement in silver priced in Australian dollars is primarily the result of a significant shift in global real yields and a diverging outlook between the U.S. Federal Reserve and the Reserve Bank of Australia. A surprise uptick in U.S. inflation expectations has forced a hawkish repricing of the Fed's terminal rate, driving institutional investors to rotate out of non-yielding precious metals. This upward pressure on U.S. Treasury yields has diminished the relative attractiveness of silver, which often functions as a zero-coupon hedge against monetary debasement.
On the local side, the Australian dollar has remained unexpectedly robust due to resilient domestic economic indicators and elevated prices for key bulk commodity exports like iron ore. This currency strength has exacerbated the decline in the XAG/AUD pair, as the purchasing power of the Australian dollar increased relative to the softening global silver spot price. When the Australian dollar strengthens while global silver prices are under pressure, the local currency valuation of the metal experiences a compounded downward move, triggering stop-loss orders among systematic trend-following funds.
Demand-side expectations have also been dampened by cooling momentum in the global renewable energy sector. Silver, a critical component in the manufacturing of high-efficiency solar cells, has seen a temporary reduction in off-take agreements as manufacturers work through existing stockpiles amid higher financing costs. This inventory digestion phase, coupled with a lack of immediate supply disruptions from major mining jurisdictions in South America, has shifted the short-term market balance toward a modest surplus.
Furthermore, institutional capital flows indicate a strategic reduction in long positions within the precious metals complex. Data from major exchanges suggest that speculators are liquidating positions in favor of cash and short-term debt instruments to capitalize on higher nominal yields. The absence of a major geopolitical catalyst to drive safe-haven buying has left silver exposed to this macro-driven sell-off.
Looking forward, the market remains focused on the interaction between industrial demand cycles and central bank liquidity. While the structural case for silver remains linked to the electrification of the global economy, the current price action reflects a tactical adjustment to a higher-for-longer interest rate environment and a strong Australian currency. Risks to the downside persist if global manufacturing activity continues to stagnate, though any pivot in U.S. monetary policy could quickly reverse the current trend.
Technical Analysis of Silver/AUD (XAGAUD)
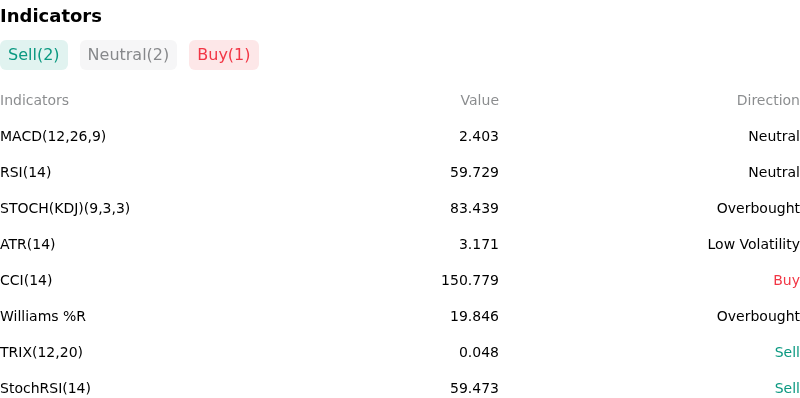
Technically, Silver/AUD (XAGAUD) shows a MACD (12,26,9) value of 2.403, indicating a neutral signal. The RSI at 59.729 suggests neutral condition and the Williams %R at 19.846 suggests overbought condition. Please monitor closely.
More details about Silver/AUD (XAGAUD)
Recent Events and Risks:
- Softening Industrial Demand in Asia: Recent data indicating a contraction in China’s photovoltaic and electronics manufacturing sectors has raised concerns about a reduction in silver’s primary industrial consumption channel, leading to institutional selling of XAG contracts.
- RBA Hawkishness Strengthening AUD: Recent communications from the Reserve Bank of Australia emphasizing the need for restrictive policy to counter sticky domestic inflation have bolstered the Australian Dollar, creating significant downside pressure on the XAGAUD cross via the denominator effect.
- Rising Real Yields and Opportunity Cost: Resilient economic indicators over the last 48 hours have driven global sovereign bond yields higher, increasing the opportunity cost of holding non-yielding precious metals and triggering long-liquidation in silver futures.
- Technical Support Breach and Positioning Unwind: Silver’s failure to maintain key psychological price floors has prompted systematic trend-following funds to reduce exposure, exacerbating intraday volatility as liquidity thins and sell-stops are triggered in the spot market.
Recommended Articles


