


XRP (XRPUSD) Is down 1.00% on Aug 11: Why It Happened
XRP (XRPUSD) is down 1.00% at Aug 11 02:25(ET), now at $1.0093, with a 7-day down of 6.36%.
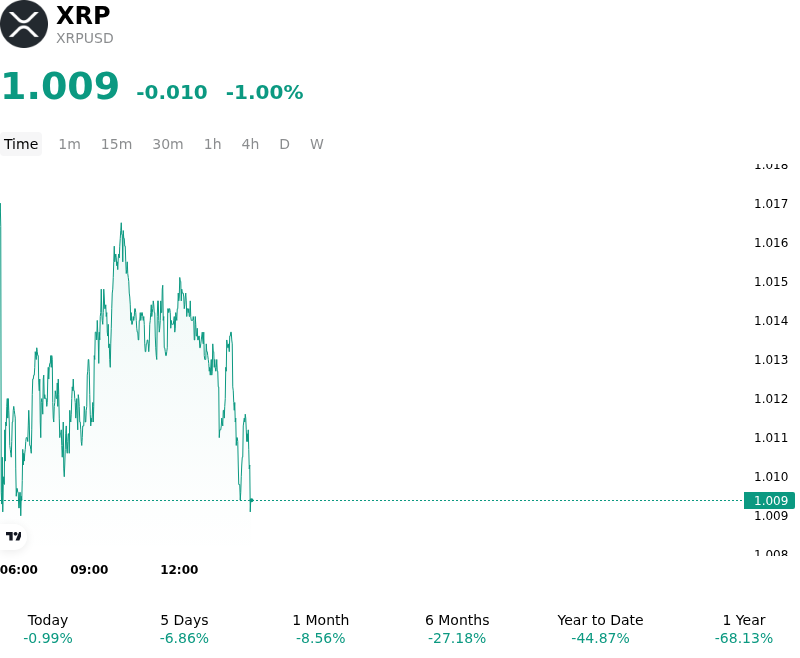
What is driving XRP (XRPUSD)’s stock price down today?
XRP has experienced a period of selling pressure as market participants recalibrate their exposure amid a broader strengthening of the US Dollar and a corresponding rise in Treasury yields. The intraday volatility reflects a shift in global macro liquidity conditions, where renewed expectations of a restrictive Federal Reserve policy have dampened the appeal of digital assets. Institutional investors, who have become more active in the XRP ecosystem following the maturation of cross-border payment frameworks, appear to be moving toward a more defensive posture as risk-off sentiment permeates the broader financial markets.
The decline is further exacerbated by a temporary exhaustion of the momentum that had been driven by expectations surrounding spot XRP exchange-traded product flows. While institutional adoption of Ripple’s ledger for institutional liquidity and stablecoin settlements remains a structural tailwind, the lack of immediate regulatory or corporate catalysts has led to a phase of consolidation. Traders are closely monitoring the support levels as the market processes the recent surge in speculative positioning, which has left the asset vulnerable to cascading liquidations in the derivatives market.
On-chain metrics indicate a slight reduction in whale accumulation and a shift of tokens toward exchange wallets, suggesting that some large-scale holders are realizing gains or hedging against further downside risk. This profit-taking behavior is common following periods of significant outperformance, particularly as the market transitions from a narrative-driven phase to one focused on actual network utility and volume. The increased volatility is also a byproduct of thinning liquidity in the European and North American trading sessions, which has amplified the impact of sell orders on the order book.
Despite the current pullback, the underlying narrative for XRP continues to center on its integration into global financial infrastructure and the potential for expanded institutional use cases. However, in the immediate term, the price action remains tethered to broader crypto market sentiment and the prevailing macroeconomic environment. Investors are likely to remain cautious until there is more clarity regarding the trajectory of inflation and its implications for global liquidity, as well as any new developments regarding the operational scaling of decentralized finance applications on the XRP Ledger.
Technical Analysis of XRP (XRPUSD)
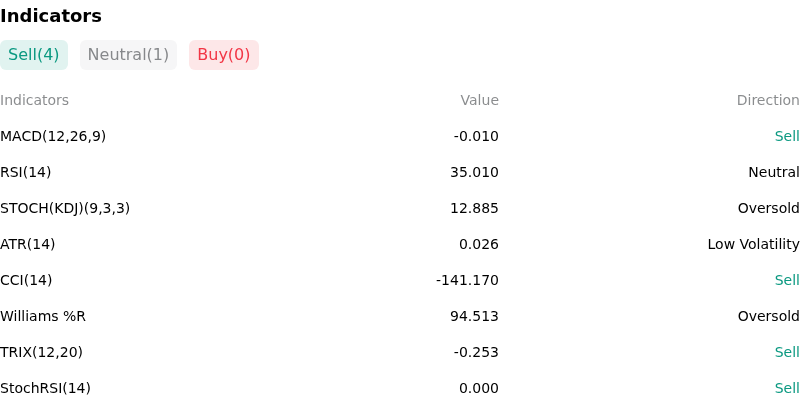
Technically, XRP (XRPUSD) shows a MACD (12,26,9) value of -0.010, indicating a sell signal. The RSI at 35.010 suggests neutral condition and the Williams %R at 94.513 suggests oversold condition. Please monitor closely.
More details about XRP (XRPUSD)
p>Recent Events and Risks:
- Regulatory Litigation and Appellate Uncertainty: The ongoing legal battle between the SEC and Ripple Labs remains a primary downside driver as the SEC’s appeal of the July 2023 ruling regarding programmatic sales creates a protracted period of legal ambiguity, potentially stalling broader institutional adoption and listing expansions on U.S.-regulated platforms.
- Heightened Whale Exchange Inflows: On-chain monitoring has detected significant movements of XRP from private wallets to major centralized exchanges, including Bitstamp and Bitso, over the last 48 hours, signaling an increased probability of large-scale spot selling and intensified overhead resistance.
- DXY Strength and Liquidity Contraction: Recent resilience in the U.S. Dollar Index (DXY) and rising Treasury yields have created a "risk-off" environment, disproportionately affecting XRPUSD as liquidity pivots toward safer assets, leading to a breakdown in short-term support levels and weakening buy-side demand.
- Leverage Unwind and Funding Rate Extremes: An accumulation of long-biased open interest in the perpetual futures market has pushed funding rates to levels that suggest an overheated market, leaving the price vulnerable to a "long squeeze" or liquidation cascade if XRP fails to maintain current psychological support thresholds.
Recommended Articles


