


Gold/Euro (XAUEUR) Moved Sharply on Aug 5: Inventories, the Dollar, or Geopolitics?
Gold/Euro (XAUEUR) is up 2.18% at Aug 5 01:50(ET), now at $3609.63, with a 7-day up of 1.87%.
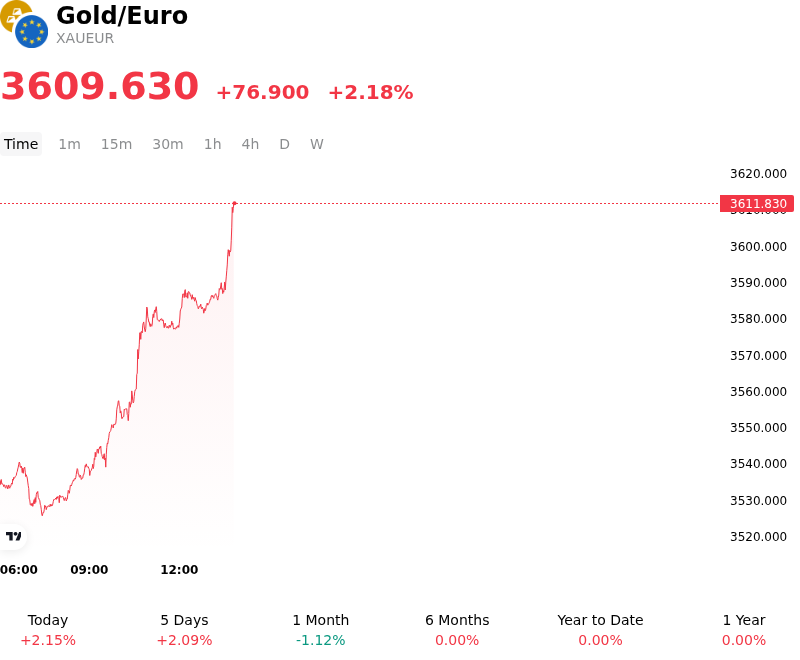
What is driving Gold/Euro (XAUEUR)’s stock price up today?
The sharp appreciation in gold priced in euros is primarily driven by a significant repricing of European Central Bank monetary policy expectations following a series of disappointing economic indicators across the Eurozone. Softening industrial production and a sharp decline in regional manufacturing purchasing managers indices have fueled speculation that the ECB will need to accelerate its easing cycle to prevent a deeper recessionary environment. This shift has compressed euro-denominated real yields, reducing the opportunity cost of holding non-yielding assets like bullion and driving a rotation of capital out of traditional fixed-income instruments and into precious metals.
Furthermore, heightened geopolitical uncertainty and renewed concerns regarding regional fiscal stability have revitalized gold's status as a premier safe-haven asset. Institutional investors are increasingly seeking protection against tail risks and potential disruptions to energy supplies, which remain a sensitive point for the European economy. The move in the euro-denominated gold price reflects not only the intrinsic strength of the metal in global markets but also a mounting risk premium as market participants hedge against regional currency volatility and the erosion of purchasing power within the Eurozone.
From a technical perspective, the breakout above established resistance levels has triggered systematic buying programs and momentum-based capital inflows. As the euro faces idiosyncratic pressure from deteriorating fiscal outlooks in several member states, gold is being utilized as a strategic alternative currency. The current market balance suggests that demand is being driven by structural shifts in portfolio allocation rather than temporary speculative positioning, as fund managers prioritize capital preservation amid an increasingly fragmented global trade environment and persistent inflationary pressures in the services sector.
Looking ahead, the trajectory of this move will likely depend on the upcoming inflation prints and the ECB's rhetoric regarding its terminal rate. If the divergence between European and North American growth persists, gold priced in euros may continue to serve as a critical hedge against the relative weakness of the regional currency. Investors remain focused on central bank gold-buying activity and ETF flows, which have shown signs of stabilization, providing a robust floor for prices as institutional positioning shifts toward defensive assets.
Technical Analysis of Gold/Euro (XAUEUR)
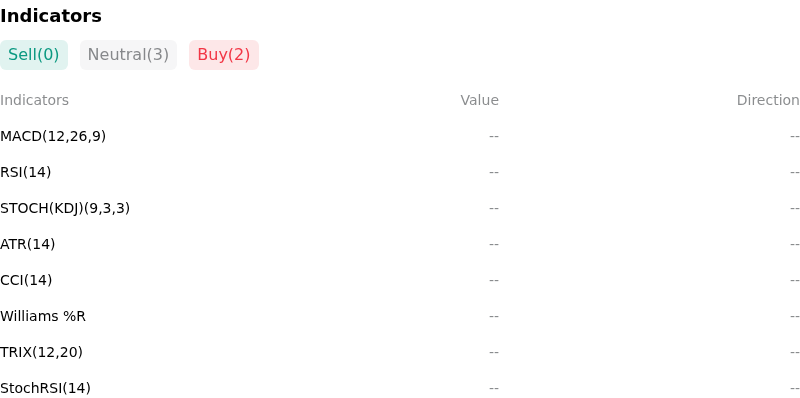
Technically, Gold/Euro (XAUEUR) shows a MACD (12,26,9) value of 1.286, indicating a neutral signal. The RSI at 54.080 suggests neutral condition and the Williams %R at 23.466 suggests buy condition. Please monitor closely.
More details about Gold/Euro (XAUEUR)
Recent Events and Risks:
- Euro Currency Appreciation: Recent hawkish signals from European Central Bank (ECB) policymakers regarding persistent service inflation have strengthened the Euro against the US Dollar; because gold is primarily priced globally in USD, a surging Euro creates significant downward pressure on the XAUEUR cross-rate.
- Safe-Haven De-escalation: Reports of renewed diplomatic efforts and potential ceasefire negotiations in the Middle East over the last 48 hours have begun to erode the geopolitical risk premium, leading to intraday liquidations in gold as a defensive asset.
- Technical Mean Reversion: Following gold's recent ascent to psychological resistance levels, technical oscillators indicate extreme overbought conditions, triggering automated sell-programs and profit-taking by institutional desks looking to reduce exposure ahead of upcoming macro-economic volatility.
- Rising Real Yields: A recent stabilization in global sovereign bond yields, following resilient economic data, has increased the opportunity cost of holding non-yielding bullion, specifically impacting Euro-denominated investors who are seeing domestic yields stay higher for longer than previously anticipated.
Recommended Articles


