


Texas Instruments Inc Stock (TXN) Moved Down by 3.04% on Aug 3: What Signal Does It Send?
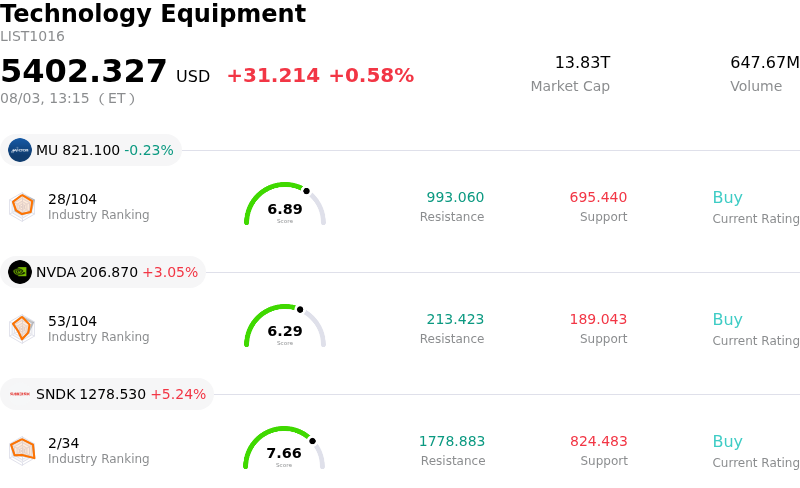
Texas Instruments Inc (TXN) moved down by 3.04%. The Technology Equipment sector is up by 0.58%. The company underperformed the industry. Top 3 stocks by turnover in the sector: Micron Technology Inc (MU) down 0.23%; NVIDIA Corp (NVDA) up 3.09%; SanDisk Corporation (SNDK) up 5.24%.
What is driving Texas Instruments Inc (TXN)’s stock price down today?
Texas Instruments is currently facing downward pressure primarily driven by a cautious outlook within the industrial and automotive semiconductor segments. As a primary supplier to these sectors, the company’s performance is heavily tethered to global manufacturing activity. Recent macroeconomic data indicating a slowdown in industrial production and a cooling automotive market has led investors to reassess the near-term demand for analog chips. This broader sector rotation out of capital-intensive tech stocks has further exacerbated the intraday volatility.
The company’s long-term strategy of investing heavily in internal manufacturing capacity, specifically its transition to 300-millimeter wafer production, remains a point of contention among institutional investors. While these investments are expected to provide a cost advantage and supply chain stability over the next decade, the current high level of capital expenditure continues to weigh on free cash flow margins. In a market environment where investors are increasingly prioritizing immediate profitability and cash returns, any indication that the payoff from these capital projects might be delayed leads to swift adjustments in portfolio allocations.
Furthermore, the latest round of analyst commentary following the recent earnings cycle has shifted toward a more neutral stance. Concerns regarding inventory levels in the distribution channel suggest that the recovery in the analog market may be more elongated than previously anticipated. This lack of a clear catalyst for a rapid rebound has prompted some institutional holders to reduce their exposure, favoring companies with more direct exposure to high-growth artificial intelligence infrastructure rather than broad-based industrial electronics.
Sentiment is also being impacted by broader geopolitical tensions that threaten to disrupt the global semiconductor supply chain. As trade policies continue to evolve, the potential for increased regulatory scrutiny on cross-border chip sales introduces an additional layer of risk. For a company with a significant global footprint, these uncertainties often result in higher risk premiums and downward pressure on valuation multiples during periods of market instability. The combination of cyclical headwinds and high capital intensity makes the stock particularly sensitive to shifts in the macroeconomic narrative.
Technical Analysis of Texas Instruments Inc (TXN)
Technically, Texas Instruments Inc (TXN) shows a MACD (12,26,9) value of -3.828, indicating a sell signal. The RSI at 41.798 suggests neutral condition and the Williams %R at 83.861 suggests oversold condition. Please monitor closely.
Media Coverage of Texas Instruments Inc (TXN)
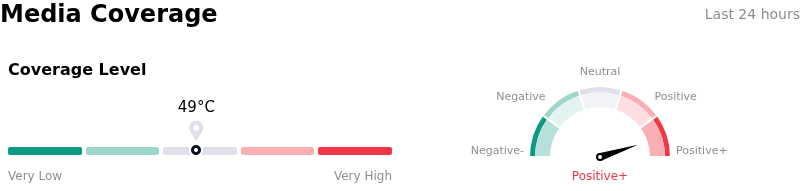
In terms of media coverage, Texas Instruments Inc (TXN) shows a coverage score of 49, indicating a moderate level of media attention. The overall market sentiment index is currently in extremely bullish zone.
Fundamental Analysis of Texas Instruments Inc (TXN)
Texas Instruments Inc (TXN) is in the Technology Equipment industry. Its latest annual revenue is $17.68B, ranking 14 in the industry. The net profit is $4.97B, ranking 10 in the industry. Company Profile
Over the past month, multiple analysts have rated the company as Hold, with an average price target of $307.18, a high of $405.00, and a low of $184.59.
More details about Texas Instruments Inc (TXN)
Company Specific Risks:
- Structural Free Cash Flow Compression: The company’s commitment to an aggressive $5 billion annual capital expenditure program through 2026 is significantly weighing on free cash flow margins, creating a financial vulnerability if the transition to 300mm wafer production does not yield the expected cost efficiencies or if demand fails to meet the increased capacity.
- Persistent Cyclical Weakness in Industrial and Automotive Sectors: Institutional analysts have highlighted that the recovery in the industrial and automotive end-markets—Texas Instruments' primary revenue drivers—remains sluggish, with prolonged inventory corrections threatening to delay the anticipated return to sequential revenue growth.
- Intensifying Market Share Competition in China: Increased domestic production of mature-node analog chips by Chinese competitors, supported by state-level subsidies, is exerting downward pressure on average selling prices (ASPs) and challenging the company’s historical market dominance in the Asia-Pacific region.
- Strategic Execution Risk Amid Shareholder Activism: Public pressure from Elliott Investment Management regarding the company's "capacity-ahead-of-demand" strategy has introduced management distraction and strategic uncertainty, as the board faces demands to prioritize immediate capital returns over long-term infrastructure investment.
Recommended Articles


