

Quant Price Forecast: Rally nears $300 as Quant takes center stage at Sibos 2026

แหล่งที่มา Fxstreet
  • Quant is up 8% on Wednesday, extending the 15% gain from the previous day.
  • Quant and Capgemini will demonstrate “Agentic Treasury Control Tower” at Sibos 2026.
  • The technical outlook for QNT is bullish, with bulls eyeing a $300 breakout.

Quant (QNT) maintains a strong bullish trend, trading around $290 on Wednesday, with bulls aiming to break above $300. The Ethereum-based protocol takes the stage at SWIFT's Sibos 2026 event, demonstrating how Capgemini AI agents help address treasury liquidity shortfalls using Quant's tokenized deposits. The technical outlook for QNT indicates a bullish bias as momentum holds firm despite signs of overbought conditions.

Quant’s tokenized deposit handling continues to fuel momentum

Quant announced a partnership with The Clearing House to serve as a settlement layer for tokenized deposits across 25 major US banks on Thursday. The protocol will display its agentic AI-powered settlement of tokenized deposits with Capgemini at SWIFT’s Sibot 2026 event. The demo will display small shortfalls fixed by the AI agent based on account balances, currencies, and market conditions, while larger tickets will require human approval before execution. 

On the derivatives side, speculative demand for Quant remains elevated. CoinGlass data shows that QNT futures Open Interest (OI) – the notional value of all active perpetual contracts – reached a new record high of $167.93 million on Wednesday. This indicates a positional buildup as the notional value surpassed Monday's $158.80 million peak while the price rose to a similar level.
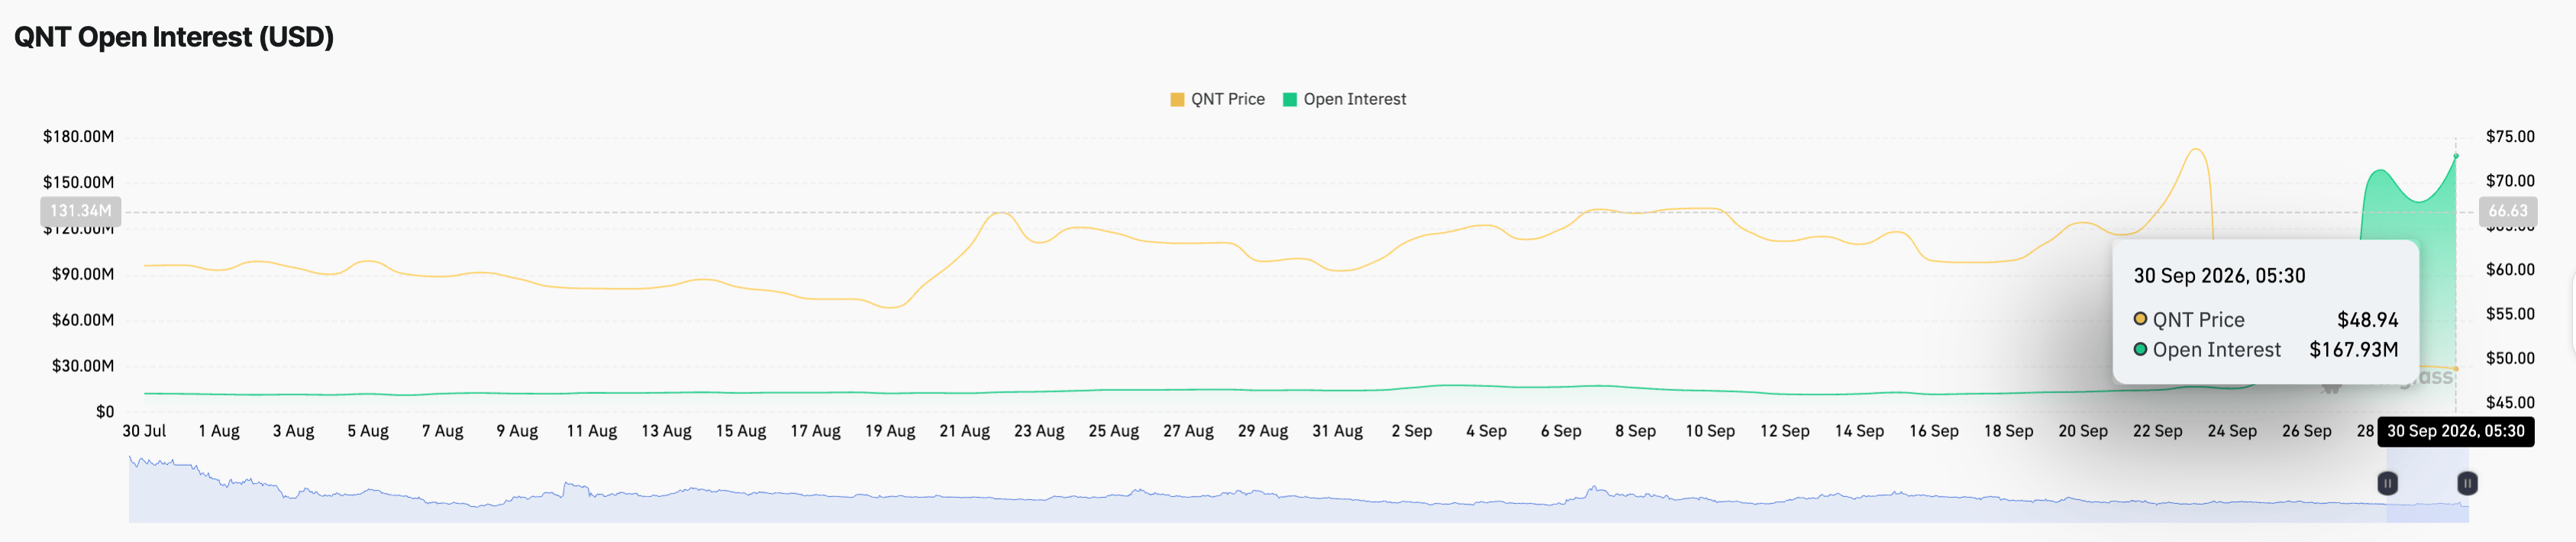
Quant Open Interest chart. Source: CoinGlass

Technical outlook: Quant’s recovery likely to surpass $300

Quant is trading around $290 at press time on Wednesday, extending its 15% gain from the previous day. QNT token extends a strong bullish phase above its major 50-, 100-, and 200-day Exponential Moving Averages (EMAs) at $99.18, $83.12, and $77.11, respectively, reinforcing a well-supported structure.
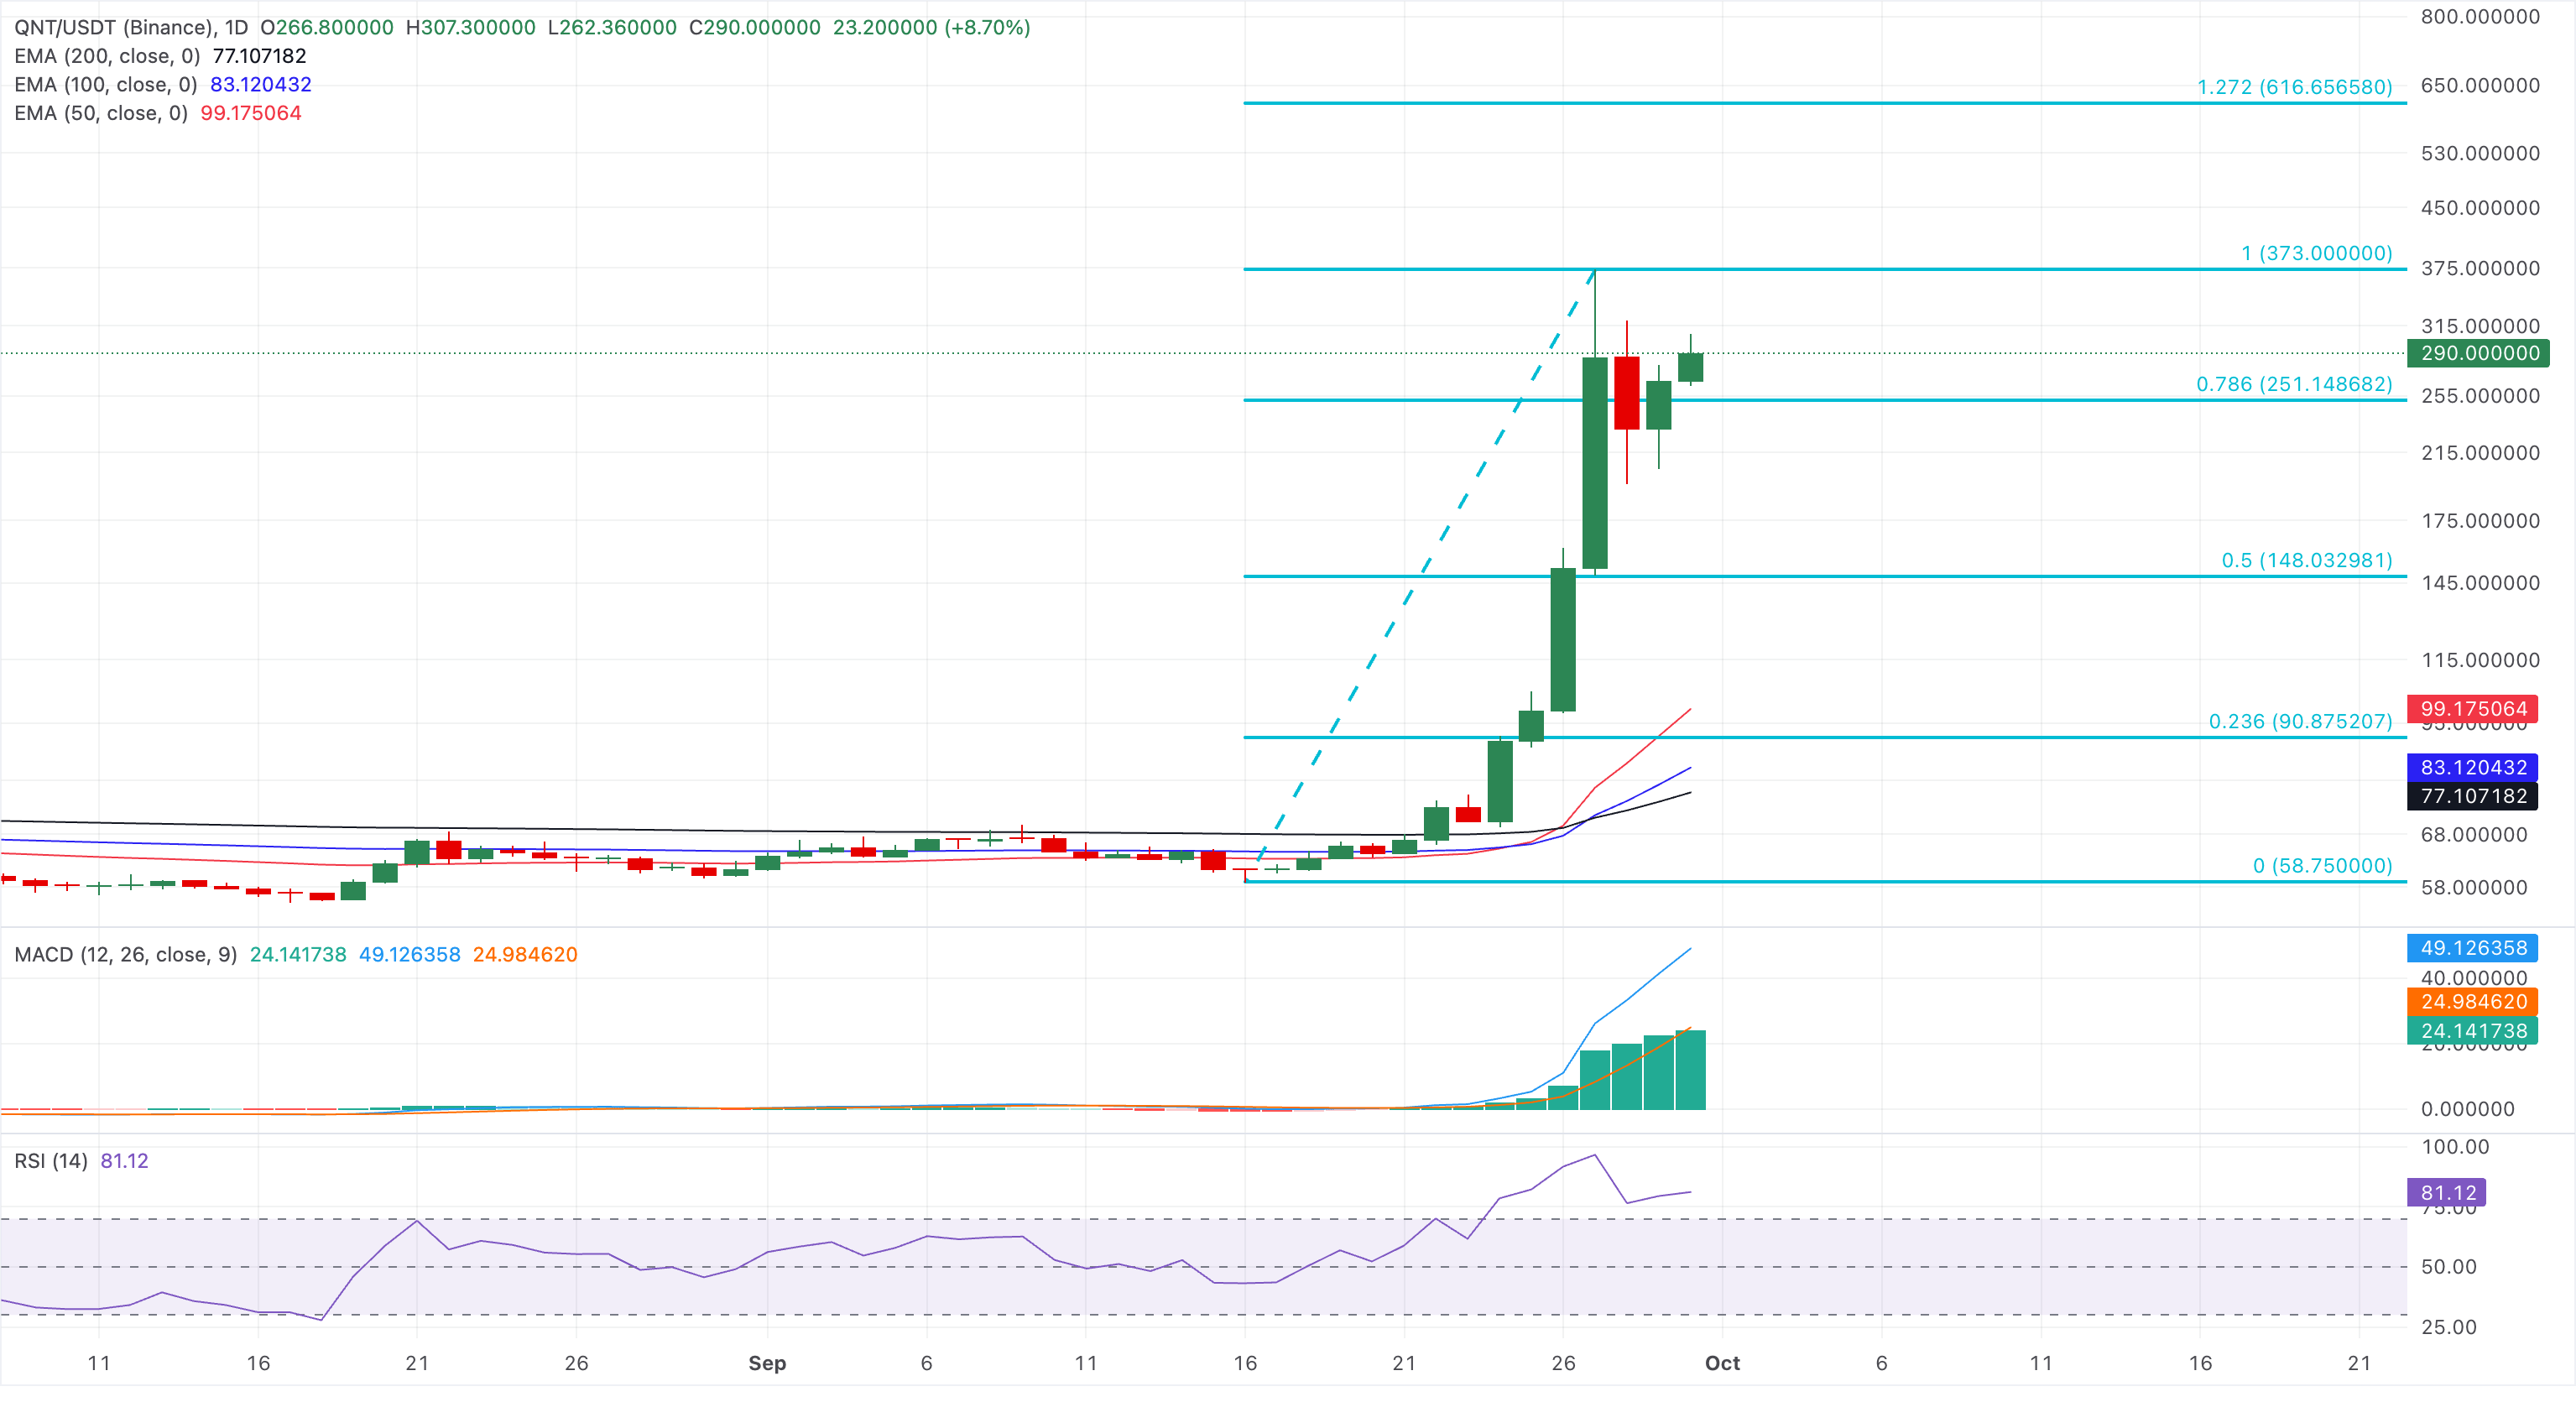
QNT/USDT daily price chart.

However, momentum on the daily chart appears stretched, with the Relative Strength Index (RSI) at 81, hovering in overbought territory, while the Moving Average Convergence Divergence (MACD) rises deep into positive territory, with expanding histograms above the zero line. This suggests an overstretched rally, but buyers continue to remain in control.

Based on the weekly chart, the QNT price is trading at levels unseen since late 2021, marking a four-year high. The Fibonacci retracement, ranging from its all-time high of $430 to its record low of $40.10, suggests that last week's 350% rally successfully reclaimed the 78.6% retracement level at $258.80. This positions the next key resistance at the $430 record high, highlighting potential upside of roughly 50%.

Chart Analysis QNT/USDT (Binance)
QNT/USDT weekly price chart.

On the flip side, a confirmed breakout below the $258.80 level could risk a steeper decline toward the 50% retracement level at $131.31.

(The technical analysis of this story was written with the help of an AI tool. Know more.)

ข้อจำกัดความรับผิดชอบ: เพื่อการอ้างอิงเท่านั้น ผลการดำเนินงานในอดีตไม่ได้บ่งบอกถึงผลลัพธ์ในอนาคต
placeholder
WTI ยังคงปรับตัวขึ้นเล็กน้อยเหนือระดับ $92.00 ท่ามกลางความวิตกกังวลเกี่ยวกับตะวันออกกลางWest Texas Intermediate (WTI) – ราคาน้ำมันดิบอ้างอิงของสหรัฐฯ – พยายามใช้ประโยชน์จากการเปิดตลาดที่ปรับตัวขึ้นเล็กน้อยในวันจันทร์ ขณะที่เทรดเดอร์เลือกที่จะรอความคืบหน้าเพิ่มเติมเกี่ยวกับวิกฤตตะวันออกกลางก่อนวางเดิมพันใหม่ อย่างไรก็ตาม WTI ยังคงมีแนวโน้มขาขึ้นตลอดช่วงเซสชั่นเอเชีย และปัจจุบันเคลื่อนไห
ผู้เขียน  FXStreet
9 เดือน 28 วัน จันทร์
West Texas Intermediate (WTI) – ราคาน้ำมันดิบอ้างอิงของสหรัฐฯ – พยายามใช้ประโยชน์จากการเปิดตลาดที่ปรับตัวขึ้นเล็กน้อยในวันจันทร์ ขณะที่เทรดเดอร์เลือกที่จะรอความคืบหน้าเพิ่มเติมเกี่ยวกับวิกฤตตะวันออกกลางก่อนวางเดิมพันใหม่ อย่างไรก็ตาม WTI ยังคงมีแนวโน้มขาขึ้นตลอดช่วงเซสชั่นเอเชีย และปัจจุบันเคลื่อนไห
placeholder
ข่าวหุ้นวันนี้ ทรัมป์ปัดดีลอิหร่านดันน้ำมันพุ่ง ดอลลาร์-บอนด์ยีลด์ ทุบหุ้น-ทองร่วงหนัก SET ลุ้นศาล รธน. บ่ายนี้ทันทุกกระแสการเงิน สรุปข่าวเด่น Forex หุ้น ทองคำ คริปโตฯ และเศรษฐกิจรอบวัน วิเคราะห์แนวโน้มตลาดด้วยข้อมูลเชิงลึก อ่านง่าย เข้าใจไว อัปเดตล่าสุดที่นี่
ผู้เขียน  Mitrade
9 เดือน 28 วัน จันทร์
ทันทุกกระแสการเงิน สรุปข่าวเด่น Forex หุ้น ทองคำ คริปโตฯ และเศรษฐกิจรอบวัน วิเคราะห์แนวโน้มตลาดด้วยข้อมูลเชิงลึก อ่านง่าย เข้าใจไว อัปเดตล่าสุดที่นี่
placeholder
ข่าวหุ้นวันนี้ ทรัมป์เล็งแบนส่งออกดีเซลดันน้ำมันพุ่ง บอนด์ยีลด์ 5.24% ทุบหุ้นสหรัฐ-ทองคำดิ่งหลุด $4,130 ขณะ SET ซึมหลุด 1,602 จุดทันทุกกระแสการเงิน สรุปข่าวเด่น Forex หุ้น ทองคำ คริปโตฯ และเศรษฐกิจรอบวัน วิเคราะห์แนวโน้มตลาดด้วยข้อมูลเชิงลึก อ่านง่าย เข้าใจไว อัปเดตล่าสุดที่นี่
ผู้เขียน  Mitrade
เมื่อวาน 06: 18
ทันทุกกระแสการเงิน สรุปข่าวเด่น Forex หุ้น ทองคำ คริปโตฯ และเศรษฐกิจรอบวัน วิเคราะห์แนวโน้มตลาดด้วยข้อมูลเชิงลึก อ่านง่าย เข้าใจไว อัปเดตล่าสุดที่นี่
placeholder
ทองคำดีดตัวจากระดับ 4,110 ดอลลาร์ ขณะที่การร่วงลงของราคาน้ำมันช่วยคลายแรงกดดันด้านเงินเฟ้อราคาทองคำ (XAU/USD) ปรับตัวเพิ่มขึ้นอย่างแข็งแกร่งกว่า 1.30% ในวันอังคาร แม้เจ้าหน้าที่ธนาคารกลางสหรัฐฯ (เฟด) จะแสดงความเห็นไปในทาง hawkish หลังแตะระดับต่ำสุดในรอบหลายสัปดาห์ใกล้ $4,110 เมื่อวันจันทร์ คู่ XAU/USD ซื้อขายอยู่ที่ $4,170 หลังดีดตัวขึ้นจากระดับต่ำสุดรายวันที่ $4,113.
ผู้เขียน  FXStreet
7 ชั่วโมงที่แล้ว
ราคาทองคำ (XAU/USD) ปรับตัวเพิ่มขึ้นอย่างแข็งแกร่งกว่า 1.30% ในวันอังคาร แม้เจ้าหน้าที่ธนาคารกลางสหรัฐฯ (เฟด) จะแสดงความเห็นไปในทาง hawkish หลังแตะระดับต่ำสุดในรอบหลายสัปดาห์ใกล้ $4,110 เมื่อวันจันทร์ คู่ XAU/USD ซื้อขายอยู่ที่ $4,170 หลังดีดตัวขึ้นจากระดับต่ำสุดรายวันที่ $4,113.
placeholder
ราคาโลหะเงินถอยลง ขณะที่อัตราผลตอบแทนพันธบัตรสหรัฐที่ปรับตัวสูงขึ้นและความตึงเครียดในช่องแคบฮอร์มุซหนุนดอลลาร์สหรัฐโลหะเงิน (XAG/USD) ปรับตัวลดลงในวันอังคาร และเคลื่อนไหวอยู่ที่ประมาณ $60.75 ณ เวลาที่รายงานข่าวนี้ ลดลง 0.38% ในวันนี้
ผู้เขียน  FXStreet
6 ชั่วโมงที่แล้ว
โลหะเงิน (XAG/USD) ปรับตัวลดลงในวันอังคาร และเคลื่อนไหวอยู่ที่ประมาณ $60.75 ณ เวลาที่รายงานข่าวนี้ ลดลง 0.38% ในวันนี้
goTop
quote