

Pi Network Price Forecast: PI tests 50-day EMA breakout as market hype builds

แหล่งที่มา Fxstreet
  • Pi Network ticks higher on Wednesday, hovering above $0.0910 after a bullish close the previous day.
  • A steady increase in PI futures Open Interest points to firm derivatives demand as the broader cryptocurrency market maintains a risk-on sentiment.
  • The technical outlook for PI shows a near-term upside bias, with bulls testing the 50-day EMA breakout.

Pi Network (PI) edges above $0.0910 at press time on Wednesday, advancing the mild recovery from the previous day. The PI futures Open Interest shows a positional buildup, possibly supporting a rebound amid broader market risk-on sentiment. The technical outlook for PI indicates a mild bullish bias as the near-term recovery tests the 50-day Exponential Moving Average (EMA) breakout at $0.0917.

Retail speculations hold firm amid broader market risk-on sentiment

Pi Network builds retail strength as investors' risk appetite remains elevated. CoinAnk data shows the PI futures Open Interest (OI) stands at $10.57 million on Wednesday, up from $10.05 million the previous day, suggesting an increase in the notional value of all active contracts. 
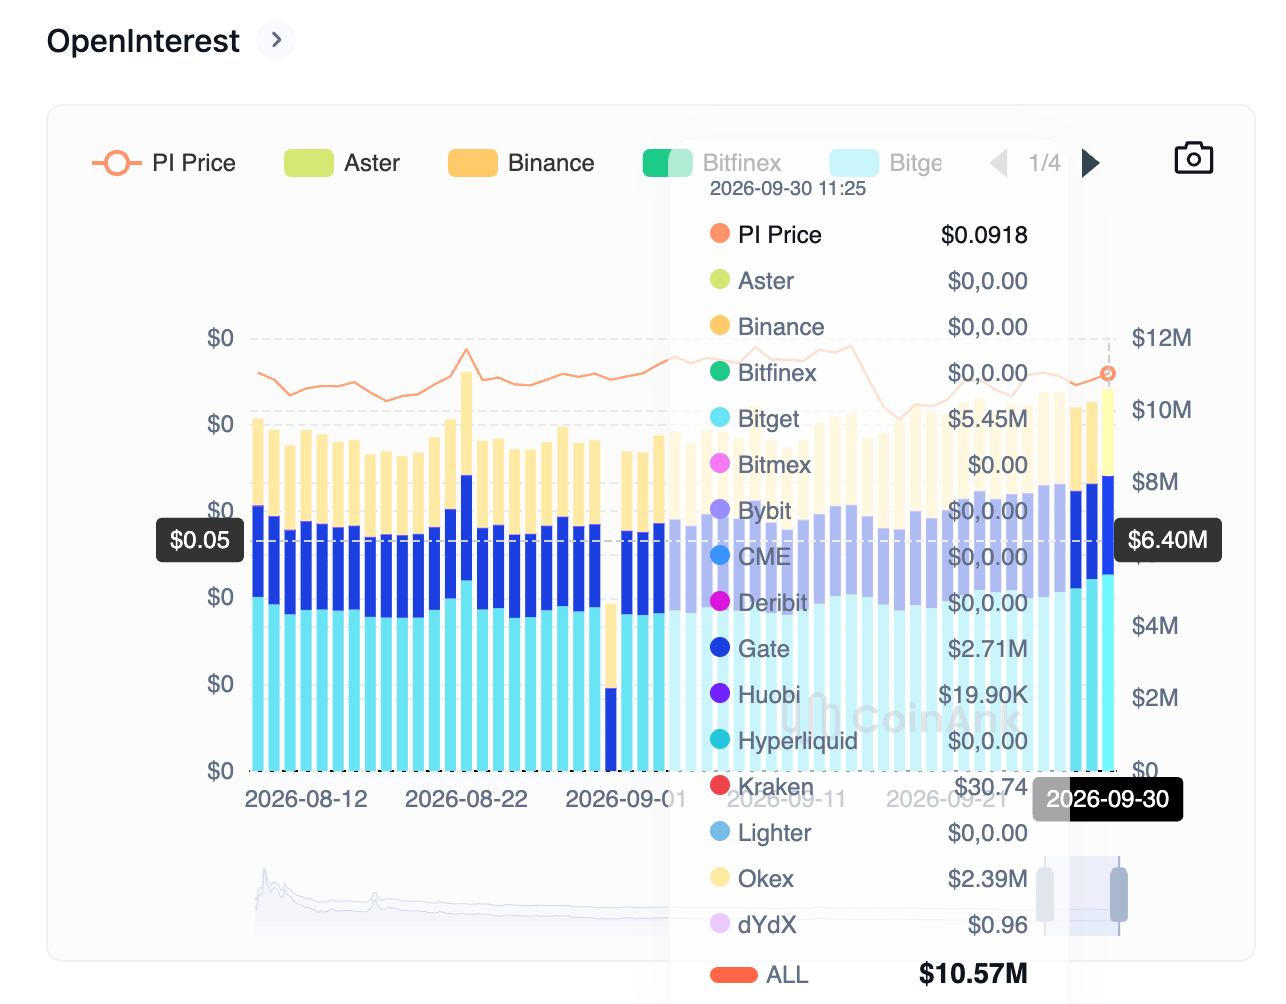
PI token Open Interest chart. Source: CoinAnk

At the same time, CoinMarketCap’s Fear and Greed Index stands at 67, continuing its decline from 74 last week. Still, the indicators suggest elevated risk appetite as it rests well above the upper band of the neutral range at 60.
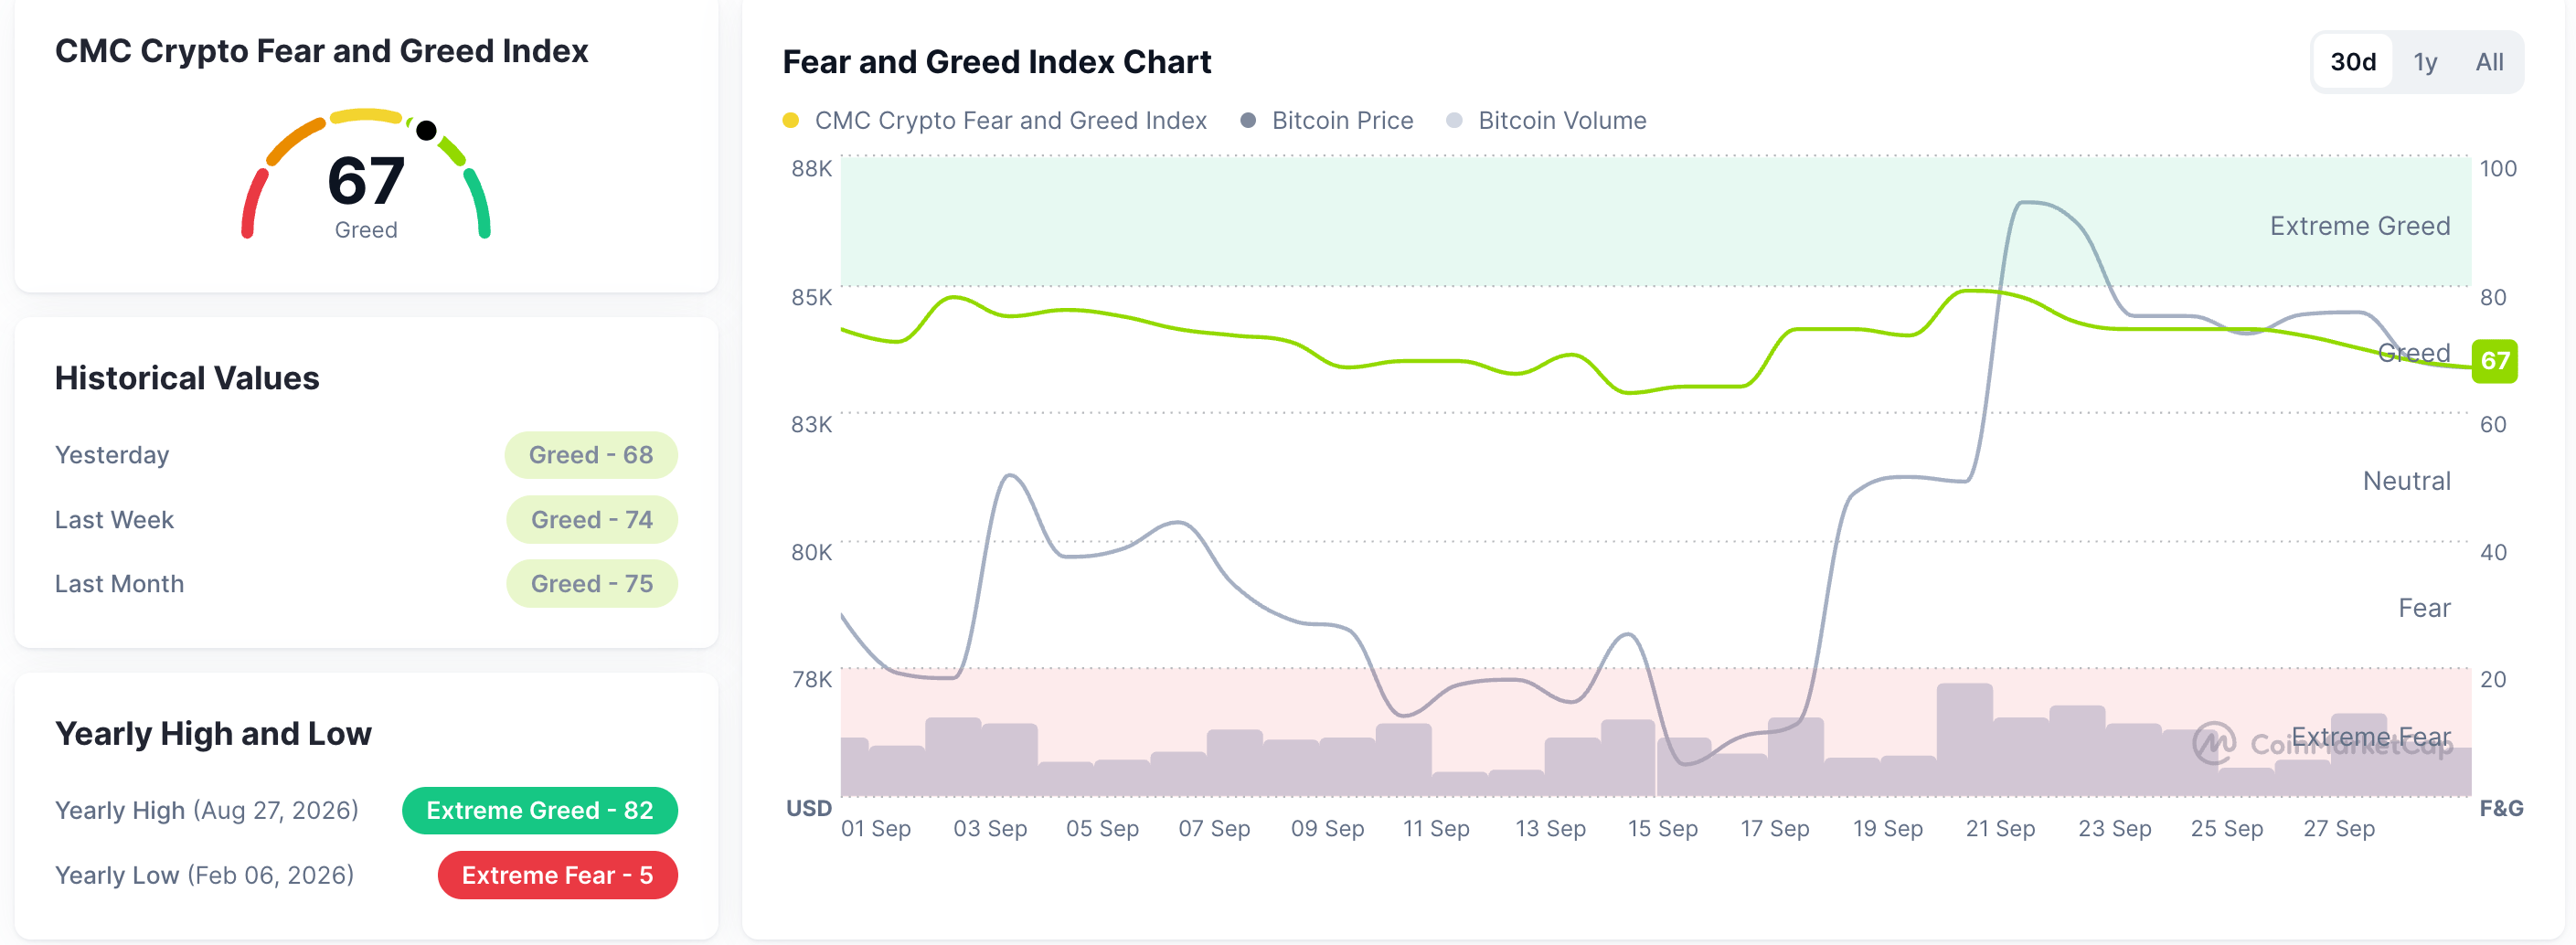
Fear and Greed Index. Source: CoinMarketCap

Technical outlook: Pi Network recovery eyes 50-day EMA breakout

Pi trades at $0.0918 at press time on Wednesday, extending its mild gains from the previous day. Still, the PI token maintains a near-term bearish bias as it tests the breakout of the 50-day EMA at $0.0917 and sits well below the 100- and 200-day EMAs at $0.1002 and $0.1235, respectively.

A confirmed breakout above the 50-day EMA could target the overhead resistance cluster formed by the 50% retracement level of the downswing from $0.1341 to $0.0704 at $0.0990 and the 100-day EMA at $0.1002.

Momentum on the daily chart remains mostly neutral, with the Relative Strength Index (RSI) at 52, rising above the midline, while the Moving Average Convergence Divergence (MACD) remains in the negative territory but holds marginally above its signal line.

Chart Analysis PI/USD (baha Crypto)
PI/USD daily price chart.

Looking down, a potential reversal from the 50-day EMA could test the 23.6% Fibonacci retracement level at $0.0827, reinforced by the July 31 low at $0.0801. Any deeper pullbacks could likely test the all-time low of $0.0704.

(The technical analysis of this story was written with the help of an AI tool. Know more.)

ข้อจำกัดความรับผิดชอบ: เพื่อการอ้างอิงเท่านั้น ผลการดำเนินงานในอดีตไม่ได้บ่งบอกถึงผลลัพธ์ในอนาคต
placeholder
WTI ยังคงปรับตัวขึ้นเล็กน้อยเหนือระดับ $92.00 ท่ามกลางความวิตกกังวลเกี่ยวกับตะวันออกกลางWest Texas Intermediate (WTI) – ราคาน้ำมันดิบอ้างอิงของสหรัฐฯ – พยายามใช้ประโยชน์จากการเปิดตลาดที่ปรับตัวขึ้นเล็กน้อยในวันจันทร์ ขณะที่เทรดเดอร์เลือกที่จะรอความคืบหน้าเพิ่มเติมเกี่ยวกับวิกฤตตะวันออกกลางก่อนวางเดิมพันใหม่ อย่างไรก็ตาม WTI ยังคงมีแนวโน้มขาขึ้นตลอดช่วงเซสชั่นเอเชีย และปัจจุบันเคลื่อนไห
ผู้เขียน  FXStreet
9 เดือน 28 วัน จันทร์
West Texas Intermediate (WTI) – ราคาน้ำมันดิบอ้างอิงของสหรัฐฯ – พยายามใช้ประโยชน์จากการเปิดตลาดที่ปรับตัวขึ้นเล็กน้อยในวันจันทร์ ขณะที่เทรดเดอร์เลือกที่จะรอความคืบหน้าเพิ่มเติมเกี่ยวกับวิกฤตตะวันออกกลางก่อนวางเดิมพันใหม่ อย่างไรก็ตาม WTI ยังคงมีแนวโน้มขาขึ้นตลอดช่วงเซสชั่นเอเชีย และปัจจุบันเคลื่อนไห
placeholder
ข่าวหุ้นวันนี้ ทรัมป์ปัดดีลอิหร่านดันน้ำมันพุ่ง ดอลลาร์-บอนด์ยีลด์ ทุบหุ้น-ทองร่วงหนัก SET ลุ้นศาล รธน. บ่ายนี้ทันทุกกระแสการเงิน สรุปข่าวเด่น Forex หุ้น ทองคำ คริปโตฯ และเศรษฐกิจรอบวัน วิเคราะห์แนวโน้มตลาดด้วยข้อมูลเชิงลึก อ่านง่าย เข้าใจไว อัปเดตล่าสุดที่นี่
ผู้เขียน  Mitrade
9 เดือน 28 วัน จันทร์
ทันทุกกระแสการเงิน สรุปข่าวเด่น Forex หุ้น ทองคำ คริปโตฯ และเศรษฐกิจรอบวัน วิเคราะห์แนวโน้มตลาดด้วยข้อมูลเชิงลึก อ่านง่าย เข้าใจไว อัปเดตล่าสุดที่นี่
placeholder
ข่าวหุ้นวันนี้ ทรัมป์เล็งแบนส่งออกดีเซลดันน้ำมันพุ่ง บอนด์ยีลด์ 5.24% ทุบหุ้นสหรัฐ-ทองคำดิ่งหลุด $4,130 ขณะ SET ซึมหลุด 1,602 จุดทันทุกกระแสการเงิน สรุปข่าวเด่น Forex หุ้น ทองคำ คริปโตฯ และเศรษฐกิจรอบวัน วิเคราะห์แนวโน้มตลาดด้วยข้อมูลเชิงลึก อ่านง่าย เข้าใจไว อัปเดตล่าสุดที่นี่
ผู้เขียน  Mitrade
เมื่อวาน 06: 18
ทันทุกกระแสการเงิน สรุปข่าวเด่น Forex หุ้น ทองคำ คริปโตฯ และเศรษฐกิจรอบวัน วิเคราะห์แนวโน้มตลาดด้วยข้อมูลเชิงลึก อ่านง่าย เข้าใจไว อัปเดตล่าสุดที่นี่
placeholder
ทองคำดีดตัวจากระดับ 4,110 ดอลลาร์ ขณะที่การร่วงลงของราคาน้ำมันช่วยคลายแรงกดดันด้านเงินเฟ้อราคาทองคำ (XAU/USD) ปรับตัวเพิ่มขึ้นอย่างแข็งแกร่งกว่า 1.30% ในวันอังคาร แม้เจ้าหน้าที่ธนาคารกลางสหรัฐฯ (เฟด) จะแสดงความเห็นไปในทาง hawkish หลังแตะระดับต่ำสุดในรอบหลายสัปดาห์ใกล้ $4,110 เมื่อวันจันทร์ คู่ XAU/USD ซื้อขายอยู่ที่ $4,170 หลังดีดตัวขึ้นจากระดับต่ำสุดรายวันที่ $4,113.
ผู้เขียน  FXStreet
11 ชั่วโมงที่แล้ว
ราคาทองคำ (XAU/USD) ปรับตัวเพิ่มขึ้นอย่างแข็งแกร่งกว่า 1.30% ในวันอังคาร แม้เจ้าหน้าที่ธนาคารกลางสหรัฐฯ (เฟด) จะแสดงความเห็นไปในทาง hawkish หลังแตะระดับต่ำสุดในรอบหลายสัปดาห์ใกล้ $4,110 เมื่อวันจันทร์ คู่ XAU/USD ซื้อขายอยู่ที่ $4,170 หลังดีดตัวขึ้นจากระดับต่ำสุดรายวันที่ $4,113.
placeholder
ราคาโลหะเงินถอยลง ขณะที่อัตราผลตอบแทนพันธบัตรสหรัฐที่ปรับตัวสูงขึ้นและความตึงเครียดในช่องแคบฮอร์มุซหนุนดอลลาร์สหรัฐโลหะเงิน (XAG/USD) ปรับตัวลดลงในวันอังคาร และเคลื่อนไหวอยู่ที่ประมาณ $60.75 ณ เวลาที่รายงานข่าวนี้ ลดลง 0.38% ในวันนี้
ผู้เขียน  FXStreet
11 ชั่วโมงที่แล้ว
โลหะเงิน (XAG/USD) ปรับตัวลดลงในวันอังคาร และเคลื่อนไหวอยู่ที่ประมาณ $60.75 ณ เวลาที่รายงานข่าวนี้ ลดลง 0.38% ในวันนี้
goTop
quote