

Dogecoin price 40% surge tests crucial resistance amid easing trade tensions
- Dogecoin's price rally halts uptrend below critical descending trendline resistance around $0.26.
- US-China trade talks in Geneva yield positive results as tariffs between the two economic giants come down.
- Renewed risk-on sentiment drives interest in DOGE as whales with 100 million to 1 billion coins increase supply share to 17.1%.
Dogecoin (DOGE) rally gains bullish momentum to exchange hands at $0.25 at the time of writing on Monday. Since the tariff-triggered crash on April 7, the largest meme coin by market capitalization has edged higher on easing trade tensions. Global markets, including crypto, are reacting positively to easing trade tensions between the United States (US) and China on top of last week's trade agreement with the United Kingdom (UK).
US-China trade talks yield results as tariffs go down
The US and China have mutually agreed to slash tariffs for 90 days, setting the stage for de-escalation of the trade war that has been thawing between the two giant economies for weeks.
The weekend-long trade talks in Geneva, Switzerland, culminated with the US agreeing to lower tariffs on Chinese goods to 30% from 145%, while China reduced duties on American goods to 10% from 125%.
During a press briefing on Monday, US Treasury Secretary Scott Bessent stressed that President Donald Trump's administration wants a "more balanced trade" and believes both parties are committed to achieving it without the risk of decoupling.
Global markets crashed in early April when President Trump imposed reciprocal tariffs on US trade partners. Although these tariffs were put on hold for 90 days, Trump imposed additional tariffs on China for retaliating. The two nations punitively escalated the tariffs, which morphed into a full-fledged trade war, calling for speedy de-escalation.
Dogecoin's performance since April 7, with a low of $0.13, has reflected a global risk-on sentiment, which also fuelled a Bitcoin (BTC) price rally towards the all-time high, marginally above $109,000.
Santiment's Supply Distribution metric validates the heightened risk-on sentiment, as whales seek exposure to the world's largest meme coin by market capitalization.
The chart below reveals that addresses with between 100 million and 1 billion DOGE currently hold 17.1% of the supply, up from 16.68% on April 13 and 15.69% on March 9.
A persistent increase in whale holdings suggests that investor confidence in Dogecoin's future is growing, as they bet on major price moves in the coming weeks.
 [12-1747045444583.01.16, 12 May, 2025].png)
Supply Distribution metric | Source: Santiment
Dogecoin tests five-month critical resistance
Dogecoin's price is climbing, up over 7% on the day to $0.25 at the time of writing. The daily chart reflects a bullish outlook, supported by key Exponential Moving Averages (EMAs) including the 50-day, 100-day, and 200-day EMAs, which sit significantly below DOGE's current price.
A buy signal from the Moving Average Convergence Divergence (MACD) indicator validates the bullish structure. The expanding green histograms above the center line signal a robust bullish tailwind.
The growing divergence between the MACD line (blue) and the signal line (red) reflects accelerating upward momentum, implying that Dogecoin's price has strong potential to break above the long-term descending trendline that has capped its price since December.
Price targets above the trendline include the resistance at $0.30, tested as support in December and January, and the area at $0.40, last tested as resistance in January.
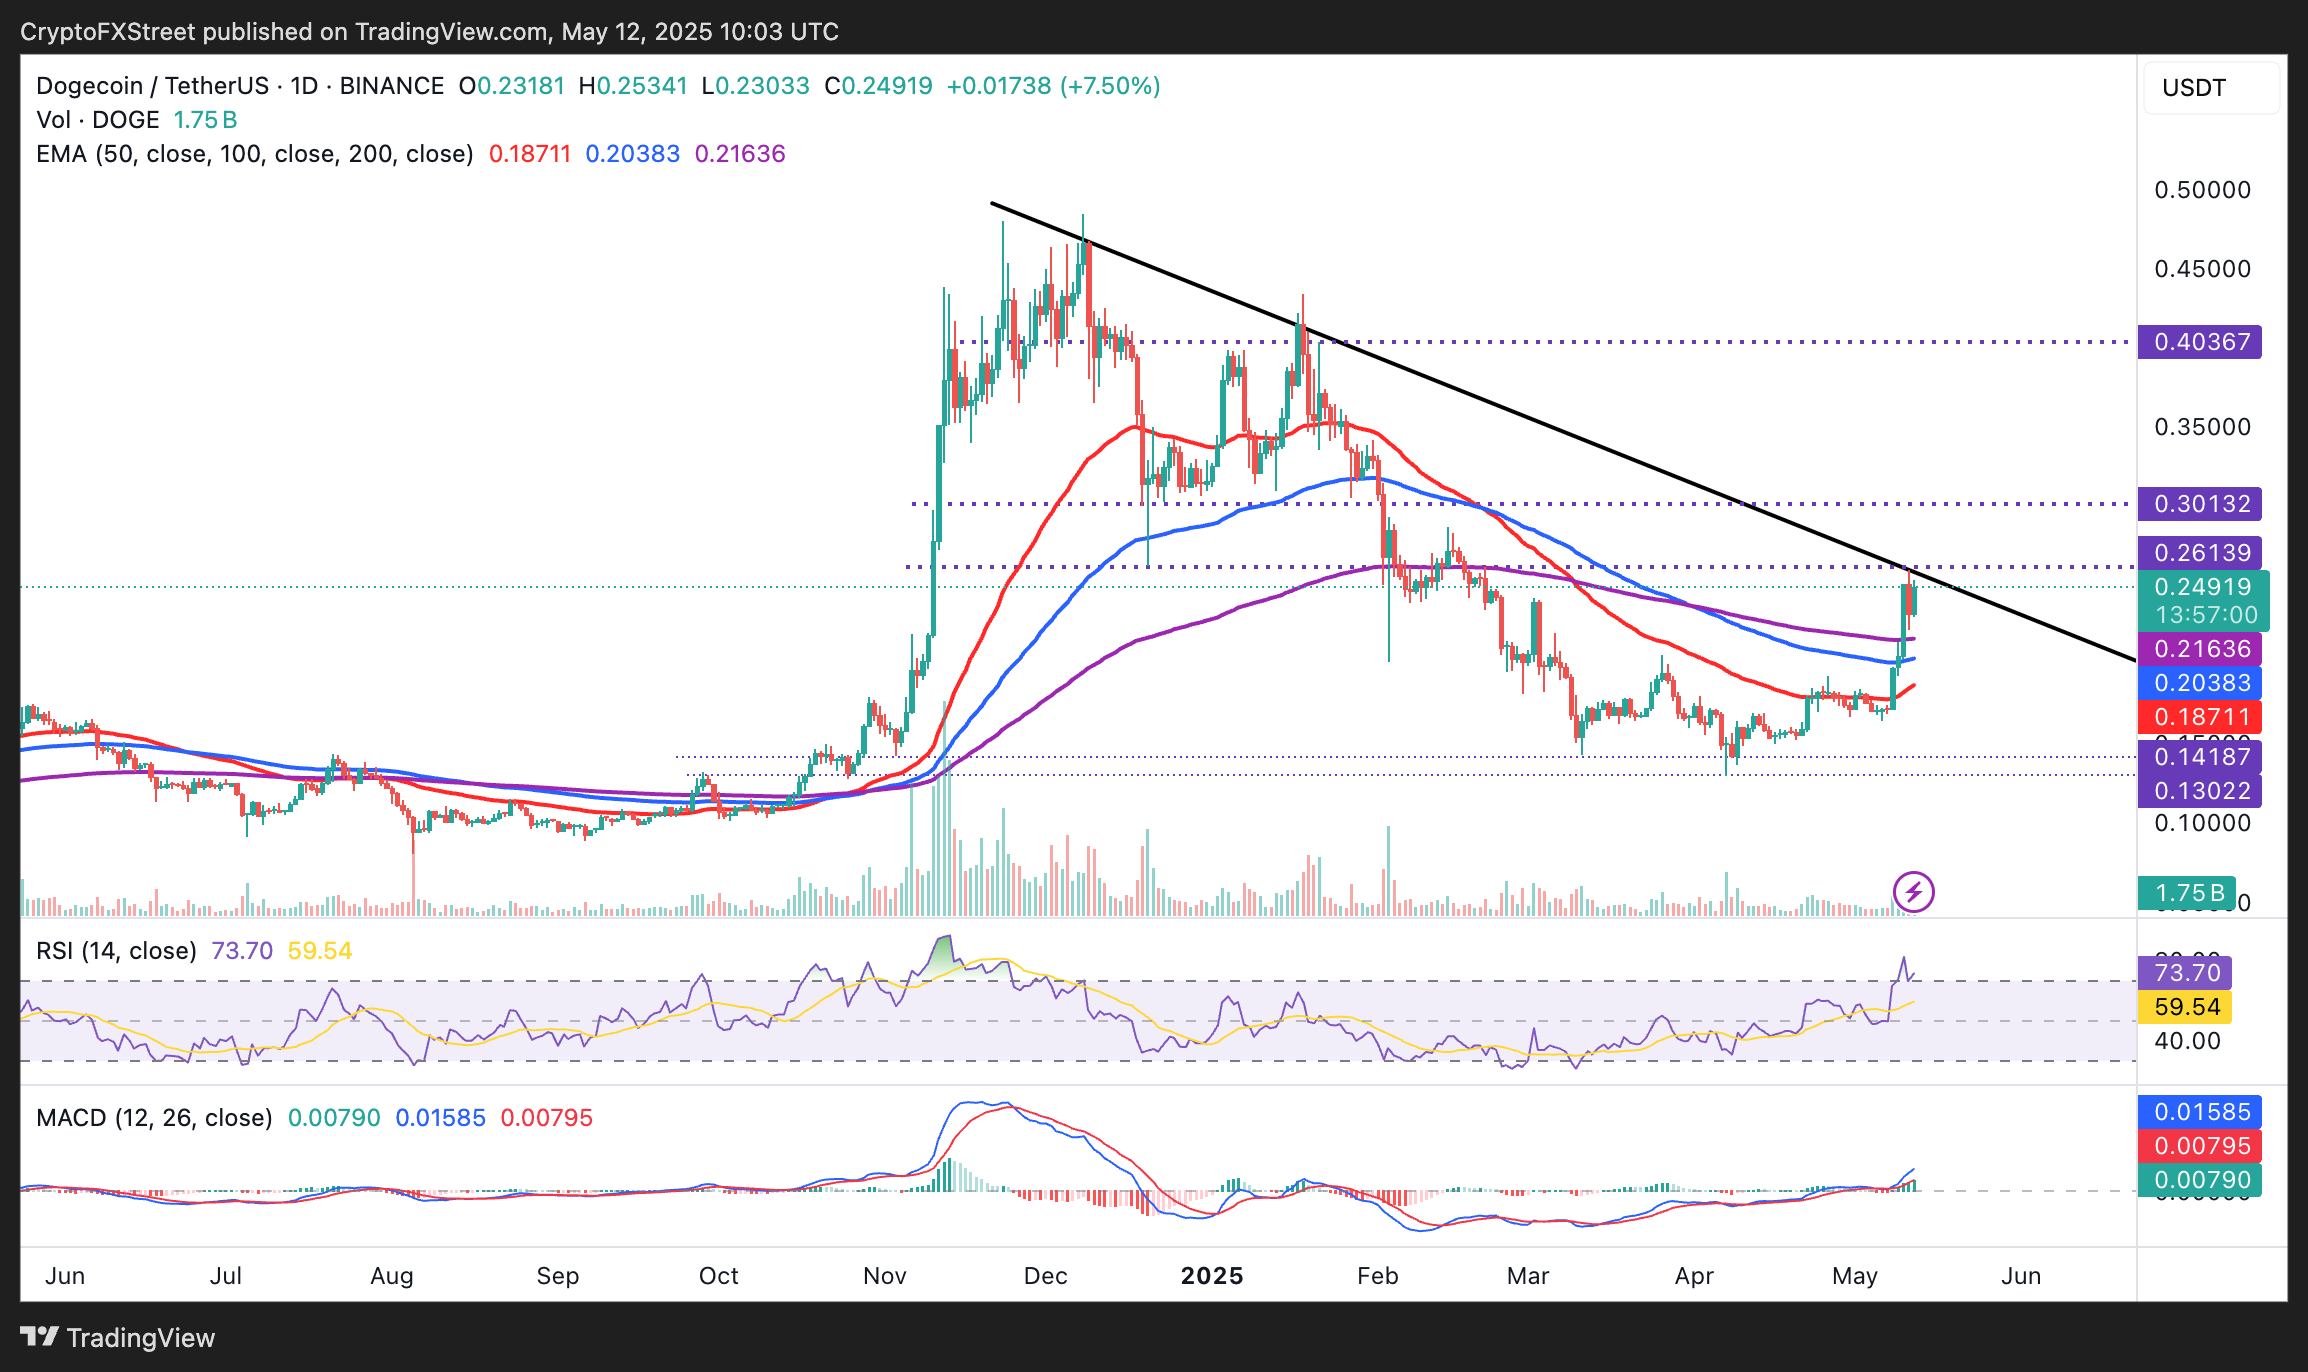
DOGE/USD daily chart
Traders should monitor for sustained trading volume and a MACD line crossover below the signal line, which could invalidate the current bullish setup.
The Relative Strength Index (RSI) indicator's uptrend into the overbought region upholds the bullish momentum.
However, RSI readings above 70 often precede drawdowns due to changing market dynamics and profit-taking. Therefore, traders should prepare for the possibility that Dogecoin fails to breach the trendline resistance and succumbs to sell-side pressure.
Rejection from the trend line would bring the 200-day EMA at $0.21, the 100-day EMA at $0.20 and the 50-day EMA at $0.18 in sight as support levels, where DOGE could collect liquidity ahead of the next recovery attempt.
Cryptocurrency metrics FAQs
The developer or creator of each cryptocurrency decides on the total number of tokens that can be minted or issued. Only a certain number of these assets can be minted by mining, staking or other mechanisms. This is defined by the algorithm of the underlying blockchain technology. On the other hand, circulating supply can also be decreased via actions such as burning tokens, or mistakenly sending assets to addresses of other incompatible blockchains.
Market capitalization is the result of multiplying the circulating supply of a certain asset by the asset’s current market value.
Trading volume refers to the total number of tokens for a specific asset that has been transacted or exchanged between buyers and sellers within set trading hours, for example, 24 hours. It is used to gauge market sentiment, this metric combines all volumes on centralized exchanges and decentralized exchanges. Increasing trading volume often denotes the demand for a certain asset as more people are buying and selling the cryptocurrency.
Funding rates are a concept designed to encourage traders to take positions and ensure perpetual contract prices match spot markets. It defines a mechanism by exchanges to ensure that future prices and index prices periodic payments regularly converge. When the funding rate is positive, the price of the perpetual contract is higher than the mark price. This means traders who are bullish and have opened long positions pay traders who are in short positions. On the other hand, a negative funding rate means perpetual prices are below the mark price, and hence traders with short positions pay traders who have opened long positions.
추천 기사


