

Dogecoin Price Forecast: DOGE risks 12% decline as whales exit
- Dogecoin is trading under pressure below downward-sloping moving averages on the daily chart.
- Wallets holding between 10 million and 100 million tokens aggressively sell DOGE as recovery stalls.
- Sentiment surrounding DOGE remains negative despite the MACD triggering a buy signal.
Dogecoin (DOGE) is trading at $0.1525 at the time of writing on Friday, as bears tighten their grip. Demand for Dogecoin has remained significantly suppressed since the October 10 flash crash, which liquidated over $19 billion in crypto assets on a single day.
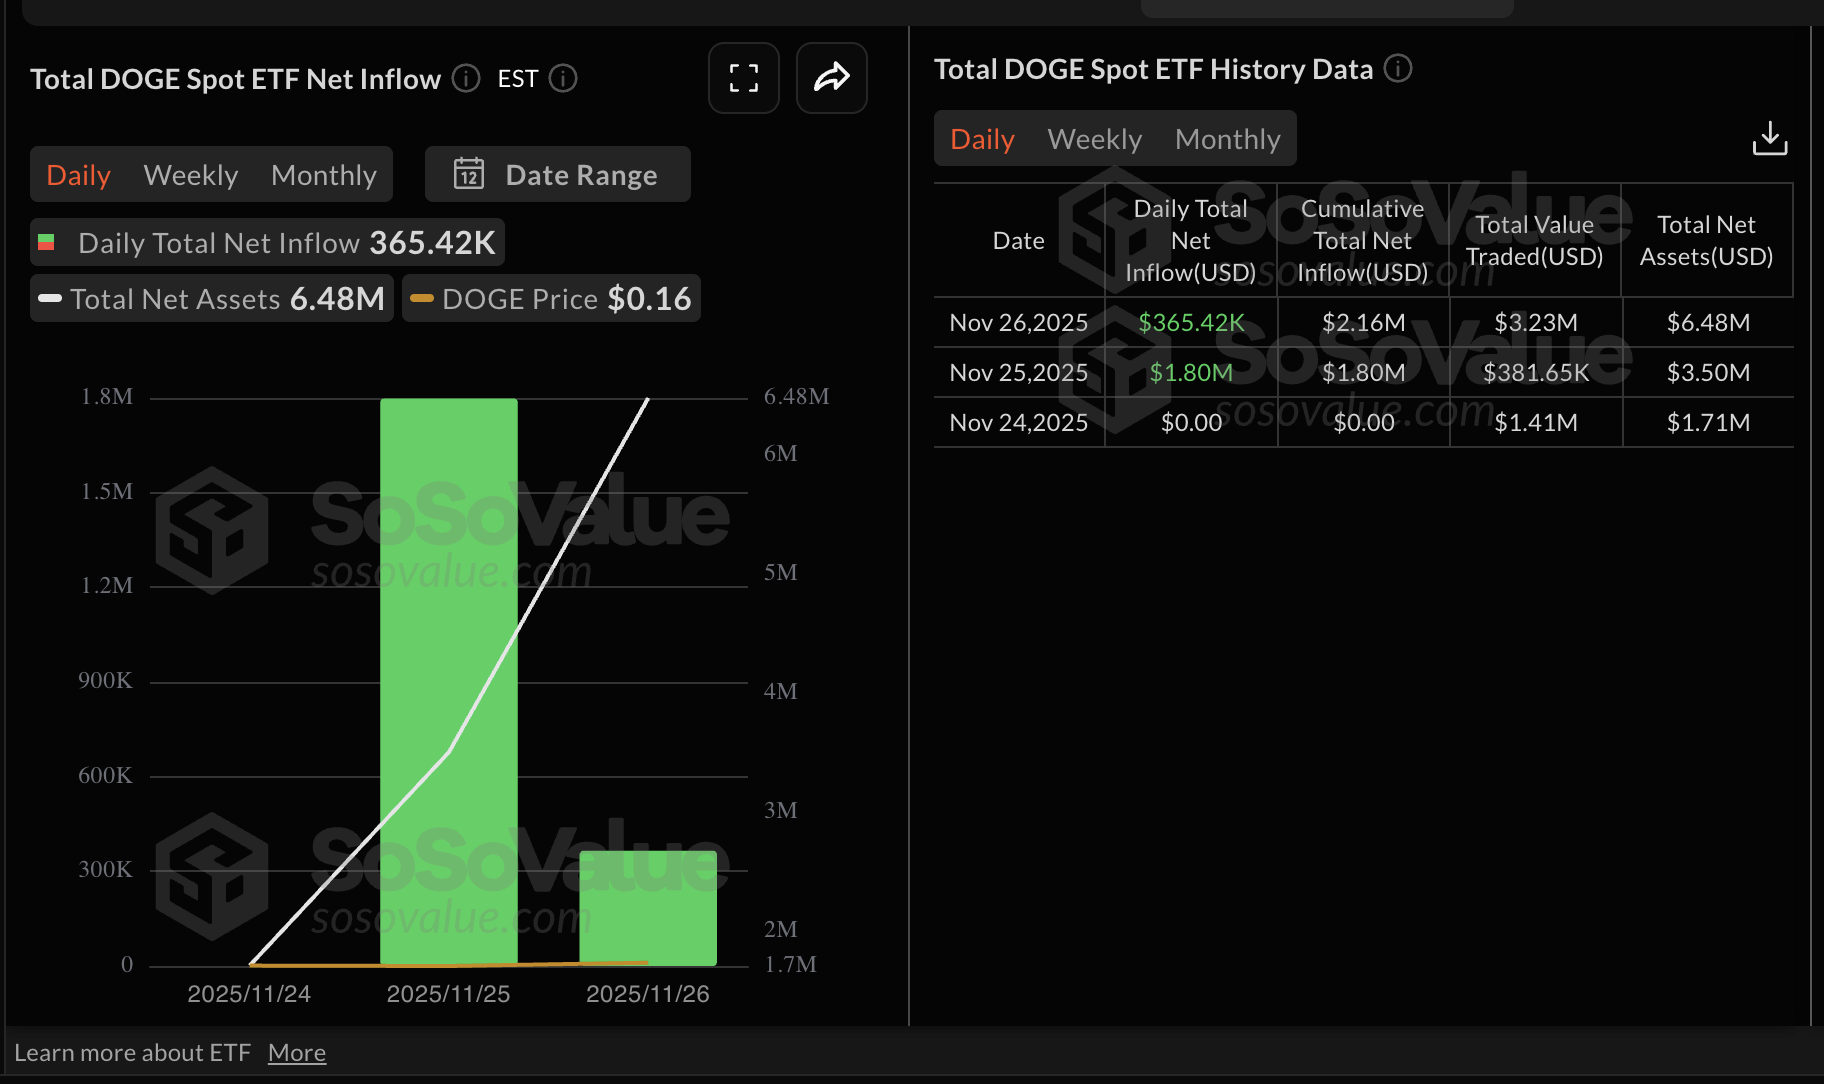
The launch of Dogecoin spot Exchange Traded Funds (ETFs) in the United States (US) was met by mild inflows of approximately $365,000 on Wednesday and $1.8 million on Tuesday. As of Wednesday, DOGE ETFs had a cumulative total net inflow of $2.16 million and net assets of $6.48 million.
Dogecoin struggles as demand falters
Large-volume investors, also known as whales, continue to offload Dogecoin, further intensifying selling pressure. The Supply Distribution metric below shows that the cohort of investors holding between 10 million and 100 million tokens currently accounts for 11.34% of the total supply, down from 15.11% on November 1 and 16.05% on October 1.
 [16-1764340473839-1764340473839.34.15, 28 Nov, 2025].png)
This sharp decline in whale holdings reinforces the sticky risk-off sentiment in the broader cryptocurrency market. If it persists, recovery of the Dogecoin price could lag, while increasing the odds of the downtrend extending toward $0.1000.
Technical outlook: Dogecoin recovery takes a breather
Dogecoin is trading at $0.1536 and below the descending 50-day Exponential Moving Average (EMA) at $0.1771. The 100- and 200-day EMAs at $0.1936 and $0.2032 continue to slope lower and are likely to cap rebounds. The Moving Average Convergence Divergence (MACD) indicator turns higher as the blue line holds above the red signal line, and the positive histogram expands around the zero level, suggesting improving momentum.
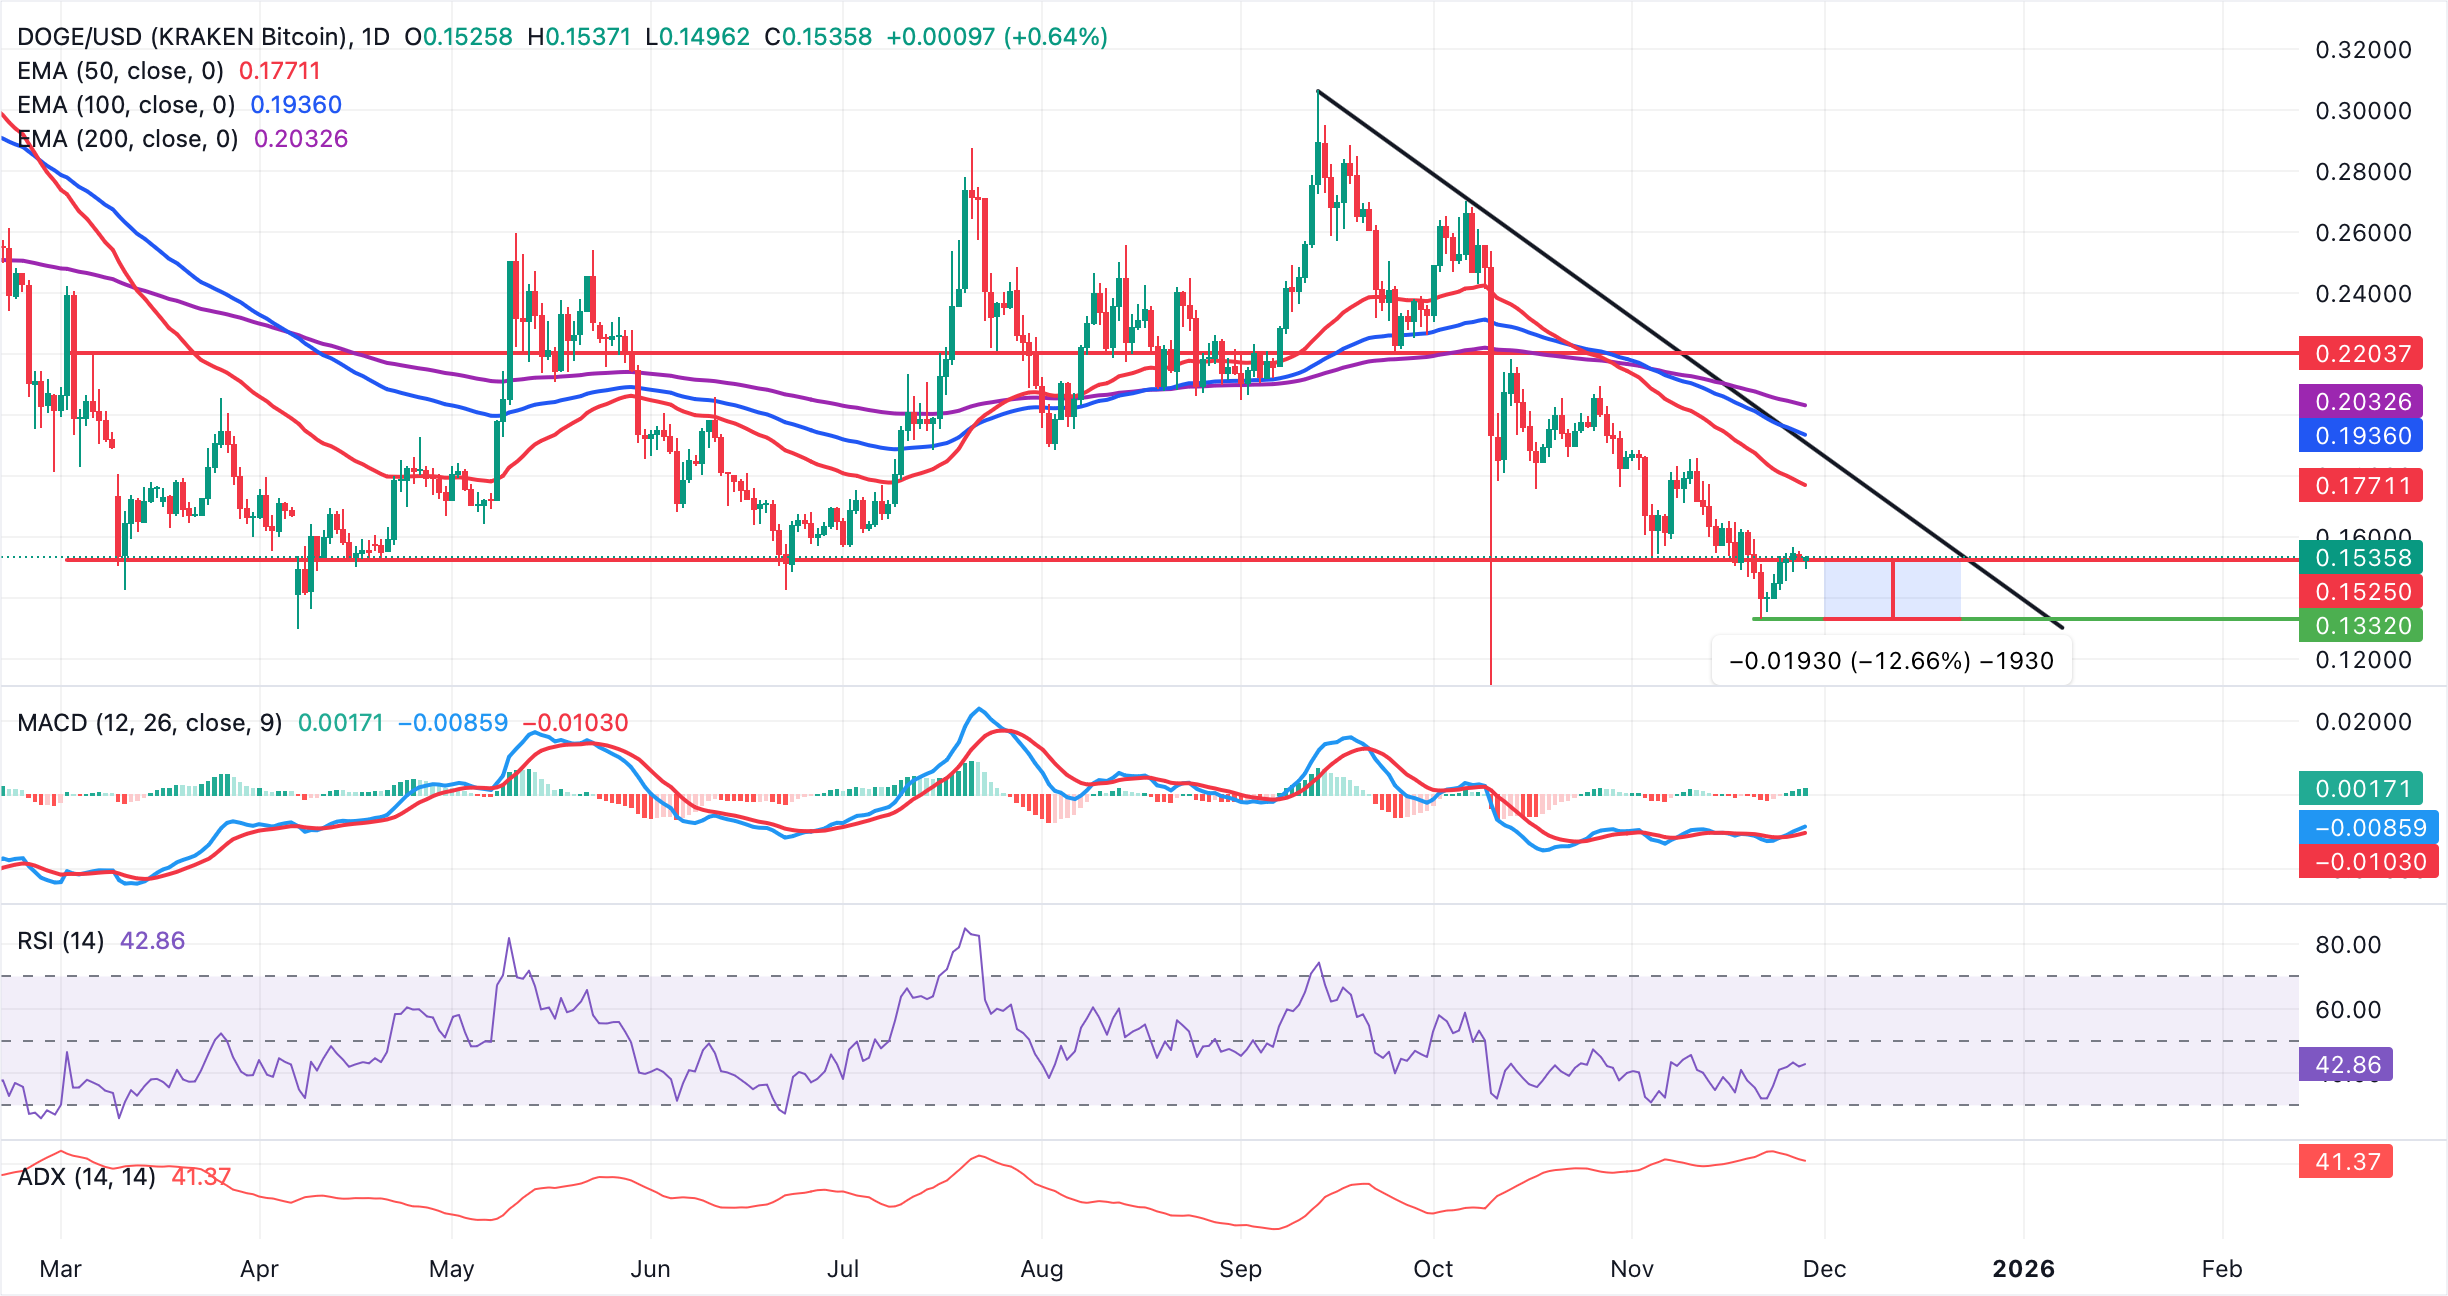
Still, the Relative Strength Index (RSI) at 42 remains below 50, tempering the recovery bias. The descending trend line from $0.3063 limits gains, and resistance is seen at $0.1901; a daily close above it could shift the bias toward a broader corrective bounce. If momentum fades and the RSI dips toward oversold territory, sellers may stay in control, extending the downtrend.
Crypto ETF FAQs
An Exchange-Traded Fund (ETF) is an investment vehicle or an index that tracks the price of an underlying asset. ETFs can not only track a single asset, but a group of assets and sectors. For example, a Bitcoin ETF tracks Bitcoin’s price. ETF is a tool used by investors to gain exposure to a certain asset.
Yes. The first Bitcoin futures ETF in the US was approved by the US Securities & Exchange Commission in October 2021. A total of seven Bitcoin futures ETFs have been approved, with more than 20 still waiting for the regulator’s permission. The SEC says that the cryptocurrency industry is new and subject to manipulation, which is why it has been delaying crypto-related futures ETFs for the last few years.
Yes. The SEC approved in January 2024 the listing and trading of several Bitcoin spot Exchange-Traded Funds, opening the door to institutional capital and mainstream investors to trade the main crypto currency. The decision was hailed by the industry as a game changer.
The main advantage of crypto ETFs is the possibility of gaining exposure to a cryptocurrency without ownership, reducing the risk and cost of holding the asset. Other pros are a lower learning curve and higher security for investors since ETFs take charge of securing the underlying asset holdings. As for the main drawbacks, the main one is that as an investor you can’t have direct ownership of the asset, or, as they say in crypto, “not your keys, not your coins.” Other disadvantages are higher costs associated with holding crypto since ETFs charge fees for active management. Finally, even though investing in ETFs reduces the risk of holding an asset, price swings in the underlying cryptocurrency are likely to be reflected in the investment vehicle too.
(The technical analysis of this story was written with the help of an AI tool)
추천 기사


