


NZD/JPY Price Analysis: Cross holds gains near 85.90 amid mixed momentum
- NZD/JPY trades near the 85.90 zone with minor gains on Monday.
- The cross maintains a cautiously bullish outlook despite mixed technical signals.
- Key support is clustered below 85.80, with resistance near 86.00.
The NZD/JPY pair is trading near the 85.90 zone on Monday, reflecting minor gains as the market approaches the Asian session. Despite the recent upside, the broader technical picture remains mixed, with conflicting signals across both short-term and long-term indicators, keeping traders cautious.
The daily technical outlook presents a complex mix of signals. The Relative Strength Index (RSI) is in the 50s, suggesting neutral momentum, while the Moving Average Convergence Divergence (MACD) indicates sell pressure, potentially limiting further gains. However, the Bull Bear Power indicator favors buying, reflecting the pair’s recent strength, while the Awesome Oscillator hovers around the 1 area, indicating largely neutral momentum. Meanwhile, the Stochastic %K (14, 3, 3) in the 40s further supports this neutral stance, underscoring the lack of a clear short-term trend.
Moving averages paint a similarly mixed picture. Shorter-term averages, including the 20-day and 30-day Exponential Moving Averages (EMAs) and Simple Moving Averages (SMAs), all in the 80s, support a buy signal, aligning with the pair’s recent bullish tone. In contrast, the longer-term 100-day and 200-day SMAs remain bearish, highlighting the ongoing divergence between short-term and long-term trends.
Zooming into the 4-hour timeframe, the technical outlook turns slightly more positive. The 4-hour MACD Level (12, 26) signals buy momentum, reflecting the pair’s recent gains, while the 4-hour Stochastic RSI Fast (3, 3, 14, 14) and the 4-hour Relative Strength Index (14) remain neutral, suggesting the potential for continued upside in the near term. The 4-hour 10-period EMAs and SMAs also support buying, though the 20-period EMA presents a contrasting sell signal, highlighting the risk of near-term pullbacks despite the broader bullish tone.
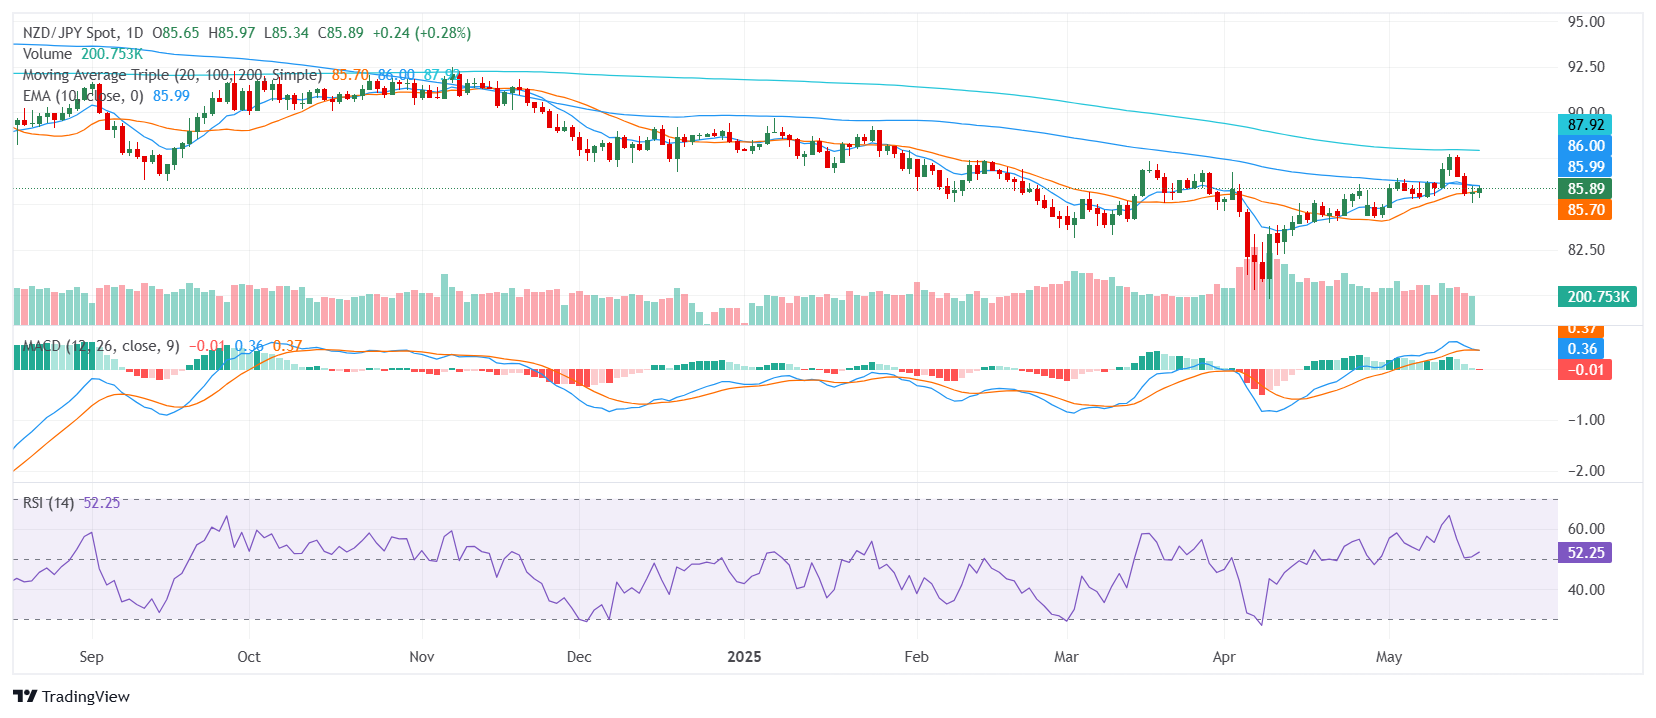
For now, immediate support is seen around 85.83, with additional levels at 85.76 and 85.71. On the upside, resistance is likely to emerge around 85.99, followed closely by 86.03 and 86.12, potentially capping further gains as the pair attempts to break through the upper end of its recent range.
Daily Chart
추천 기사


