

AUD/USD Price Forecast: Sticks to losses around mid-0.6500s, seems vulnerable to slide further
- AUD/USD remains under some selling pressure for the third straight day amid a bullish USD.
- Fears about Trump’s potential protectionist tariffs on China further undermine the Aussie.
- The technical setup favors bearish traders and supports prospects for further near-term losses.
The AUD/USD pair attracts sellers for the third successive day on Tuesday and slides back below mid-0.6500s during the first half of the European session.
The US Dollar (USD) buying remains unabated in the wake of expectations that US President-elect Donald Trump's policies will spur economic growth and boost inflation, which could limit the scope for the Federal Reserve (Fed) to ease its policy. Adding to this, concerns about Trump's potential protectionist tariffs on China undermine the China-proxy Australian Dollar (AUD) and exert additional pressure on the AUD/USD pair.
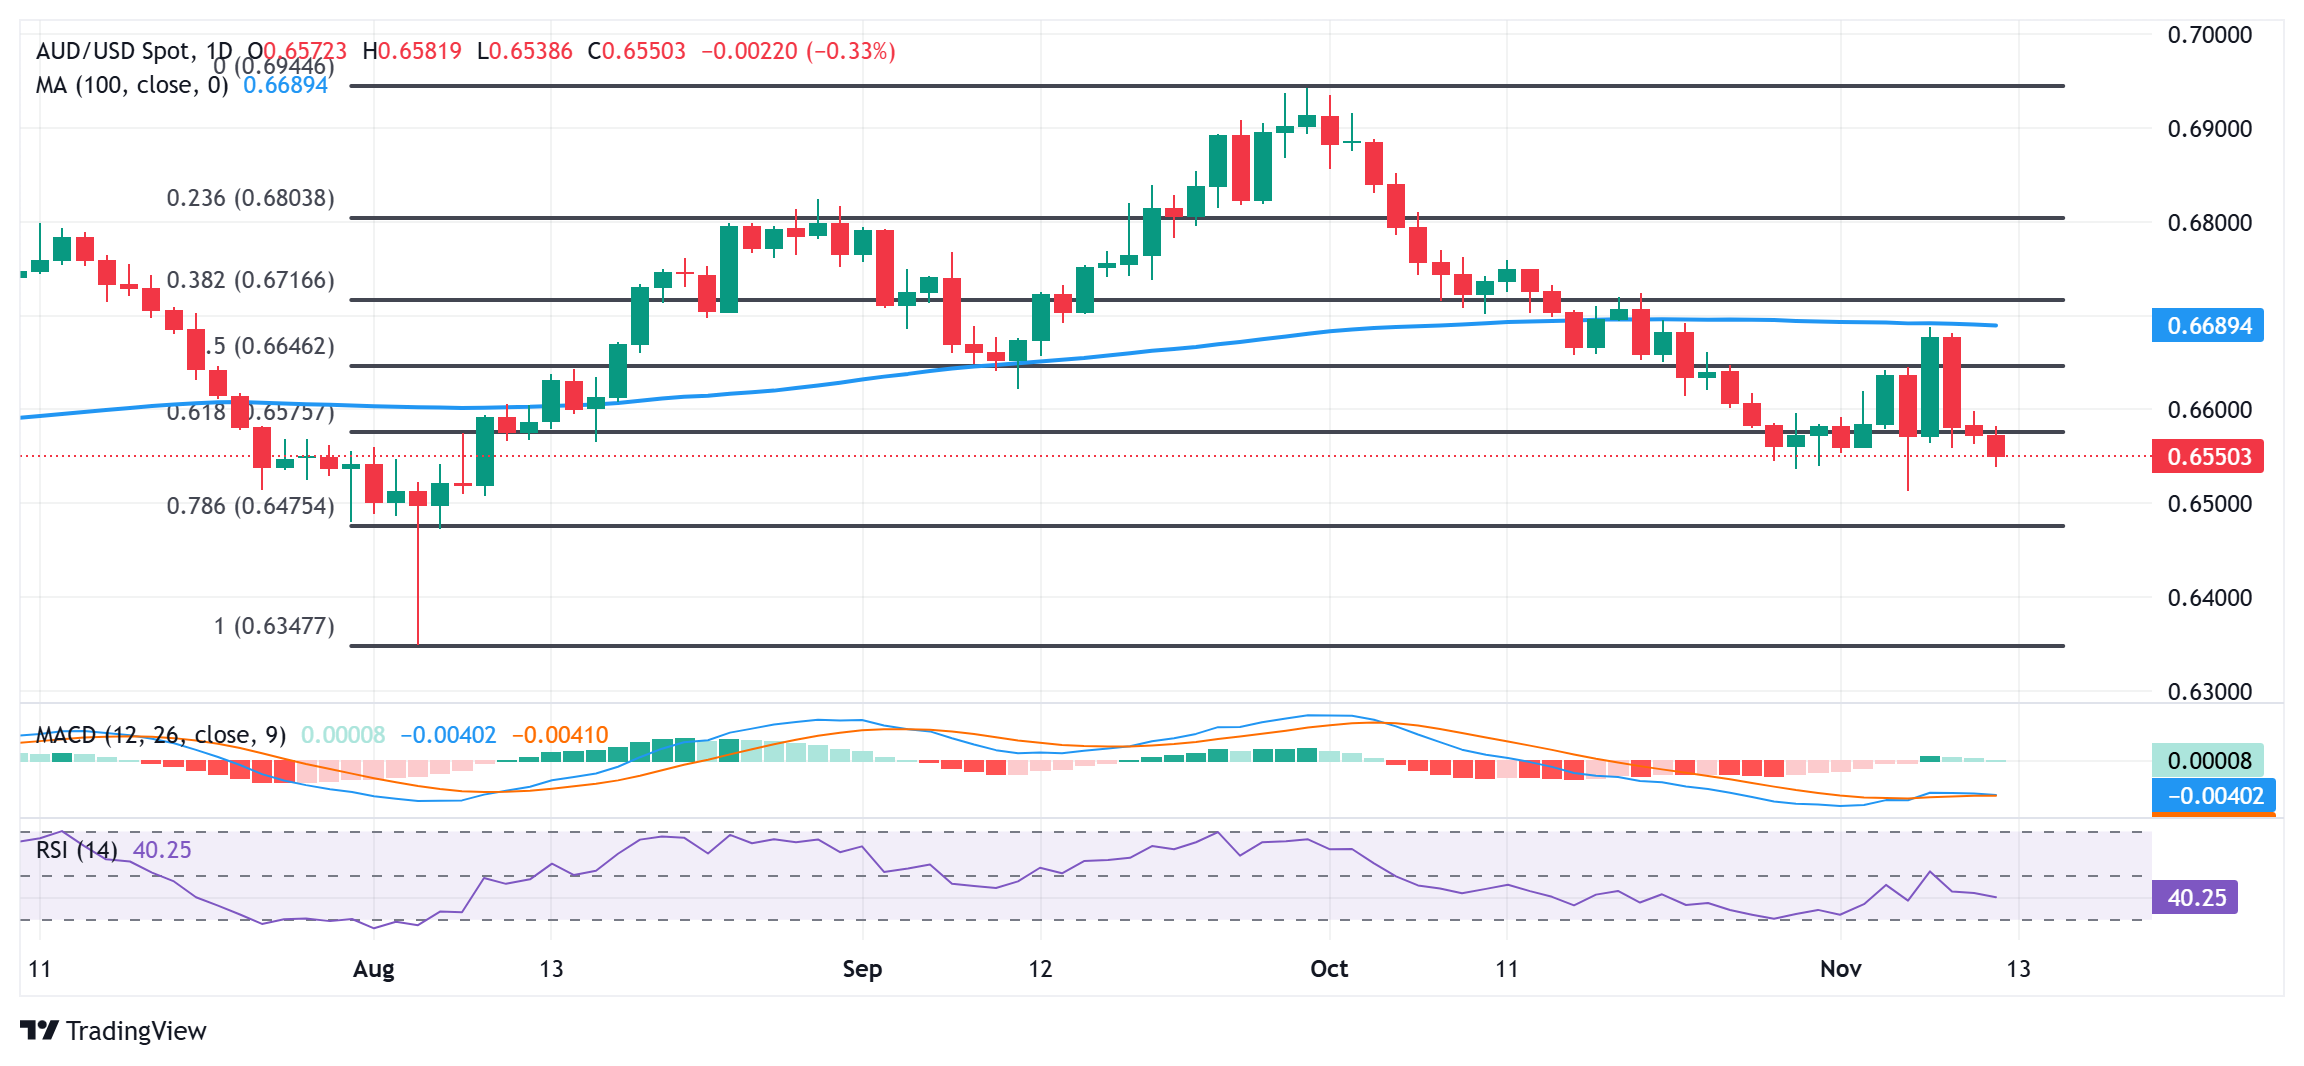
From a technical perspective, last week's failure near the 100-day Simple Moving Average (SMA) and the subsequent slide back below the 61.8% Fibonacci retracement level of the August-September rally favors bearish traders. Moreover, negative oscillators on the daily chart suggest that the AUD/USD pair could slide further towards challenging the lowest level since August 8, around the 0.6515-0.6510 region touched last week.
Some follow-through selling below the 0.6500 psychological mark should pave the way for a decline towards the next relevant support near the 0.6475-0.6470 area. The AUD/USD pair could eventually drop to the 0.6400 mark and extend the downward trajectory towards the 0.6350-0.6345 region, or the year-to-date (YTD) low touched in August.
On the flip side, any attempted recovery might now confront stiff resistance and meet with a fresh supply ahead of the 0.6600 round-figure mark. A sustained strength beyond might trigger a short-covering rally towards the 0.6635 area or the 200-day SMA. The AUD/USD pair could climb further towards retesting the 100-day SMA strong barrier, currently pegged near the 0.6685-0.6690 region, en route to the 50-day SMA, near the 0.6715-0.6720 area.
AUD/USD daily chart
Australian Dollar FAQs
One of the most significant factors for the Australian Dollar (AUD) is the level of interest rates set by the Reserve Bank of Australia (RBA). Because Australia is a resource-rich country another key driver is the price of its biggest export, Iron Ore. The health of the Chinese economy, its largest trading partner, is a factor, as well as inflation in Australia, its growth rate and Trade Balance. Market sentiment – whether investors are taking on more risky assets (risk-on) or seeking safe-havens (risk-off) – is also a factor, with risk-on positive for AUD.
The Reserve Bank of Australia (RBA) influences the Australian Dollar (AUD) by setting the level of interest rates that Australian banks can lend to each other. This influences the level of interest rates in the economy as a whole. The main goal of the RBA is to maintain a stable inflation rate of 2-3% by adjusting interest rates up or down. Relatively high interest rates compared to other major central banks support the AUD, and the opposite for relatively low. The RBA can also use quantitative easing and tightening to influence credit conditions, with the former AUD-negative and the latter AUD-positive.
China is Australia’s largest trading partner so the health of the Chinese economy is a major influence on the value of the Australian Dollar (AUD). When the Chinese economy is doing well it purchases more raw materials, goods and services from Australia, lifting demand for the AUD, and pushing up its value. The opposite is the case when the Chinese economy is not growing as fast as expected. Positive or negative surprises in Chinese growth data, therefore, often have a direct impact on the Australian Dollar and its pairs.
Iron Ore is Australia’s largest export, accounting for $118 billion a year according to data from 2021, with China as its primary destination. The price of Iron Ore, therefore, can be a driver of the Australian Dollar. Generally, if the price of Iron Ore rises, AUD also goes up, as aggregate demand for the currency increases. The opposite is the case if the price of Iron Ore falls. Higher Iron Ore prices also tend to result in a greater likelihood of a positive Trade Balance for Australia, which is also positive of the AUD.
The Trade Balance, which is the difference between what a country earns from its exports versus what it pays for its imports, is another factor that can influence the value of the Australian Dollar. If Australia produces highly sought after exports, then its currency will gain in value purely from the surplus demand created from foreign buyers seeking to purchase its exports versus what it spends to purchase imports. Therefore, a positive net Trade Balance strengthens the AUD, with the opposite effect if the Trade Balance is negative.
추천 기사


