


CME vs. Robinhood Markets: Which Financial Stock Is a Better Buy for 2027?
Key Points
CME Group operates a dominant global derivatives marketplace with industry-leading net margins and a conservative balance sheet.
Robinhood Markets has expanded into a multiproduct financial platform, achieving high revenue growth and significant net income.
Which of these two financial services companies is the better investment for your portfolio through 2027?
- Motley Fool Issues Rare "Total Conviction" Buy Alert ›
Market volatility often creates opportunities for the platforms that facilitate trading. Deciding between CME Group (NASDAQ:CME) and Robinhood Markets (NASDAQ:HOOD) involves weighing the stability of an institutional giant against a fast-growing retail disruptor.
CME Group provides the essential infrastructure for global derivatives trading, offering unmatched liquidity to professional investors. Robinhood Markets has transitioned from a simple trading app to a diversified financial services provider for the modern retail investor. Both companies are positioned to benefit from increased market activity but offer different paths for shareholders.
The case for CME
CME Group operates the world's most diverse derivatives marketplace, offering contracts across interest rates, equities, and commodities in 200 countries. Key partnerships include a 10-year agreement with Alphabet (NASDAQ:GOOG) (NASDAQ:GOOGL) and a prediction market joint venture with Flutter Entertainment (NYSE:FLUT). Because one company accounted for roughly 12% of clearing and transaction fees in its latest report, this customer concentration adds a layer of risk.
In the 12 months ended Sept. 30, 2026, revenue reached nearly $7 billion, an increase of approximately 9% over the prior period. During this time, net income was roughly $4.4 billion as the company benefited from increased trading volumes. CME maintains a high net margin of approximately 63.1%, highlighting its strength among financial stocks.
As of its December 2025 balance sheet, the debt-to-equity ratio was approximately 0.1. This ratio compares total debt to shareholder equity, indicating the company uses very little borrowed money to fund its operations. In the fiscal year ended Dec. 31, 2025, free cash flow was nearly $4.2 billion, reflecting strong cash conversion from its earnings.
The case for Robinhood Markets
Robinhood Markets provides retail brokerage, advisory, and digital banking services to millions of funded customers. Its platform supports trading in traditional assets as well as Bitcoin (CRYPTO:BTC). It also operates a joint venture with Susquehanna International Group to run an independent futures exchange and clearinghouse.
In the 12 months ended Sept. 30, 2026, revenue reached nearly $5.1 billion, fueled by revenue growth of approximately 21.1%. The company reported net income of close to $2 billion for the same period, reflecting success in scaling its subscription services and interest-earning assets. Its net margin for this time frame was roughly 39%.
As of Robinhood's December 2025 balance sheet, the debt-to-equity ratio was approximately 1.3. In the fiscal year ended Dec. 31, 2025, free cash flow reached nearly $1.6 billion, showing the company's ability to generate cash while expanding.
Risk profile comparison
CME Group faces intense competition from other global exchanges like Intercontinental Exchange (NYSE:ICE) and Nasdaq (NASDAQ:NDAQ). The company is also subject to regulatory and legislative changes that could impact its clearinghouse and transaction structures. Furthermore, the company manages operational risks related to third-party data centers, highlighted by a cooling failure in November 2025. Cybersecurity threats targeting financial infrastructure also remain a persistent risk for the exchange operator.
Robinhood Markets is sensitive to regulatory scrutiny regarding payment for order flow, which accounts for a substantial portion of its revenue. It competes with established brokerages like Charles Schwab (NYSE:SCHW) and fintech rivals that may have greater capital and brand recognition. The company also depends on a limited number of liquidity providers, such as Virtu Financial (NYSE:VIRT), to execute its trades. Additionally, legal challenges regarding the offering of event contracts could impact Robinhood's future product road map.
Valuation comparison
Robinhood Markets is cheaper by its P/S ratio, which measures market cap against sales over the past 12 months, while CME Group has a lower forward P/E.
| Metric | CME Group | Robinhood Markets |
|---|---|---|
| Forward P/E | 24.7 | 32.4 |
| P/S ratio | 15.7 | 10.7 |
Valuation metrics include sourcing from Financial Modeling Prep (FMP) and may differ from other data providers.
Which stock would I buy for 2027?
It's a little hard to pick one over the other because of the current macro environment. Specifically, the market is, as the youths say, crashing out. Robinhood stock is less than a dollar away from its 52-week low. I mean, this year-to-date chart is brutal:
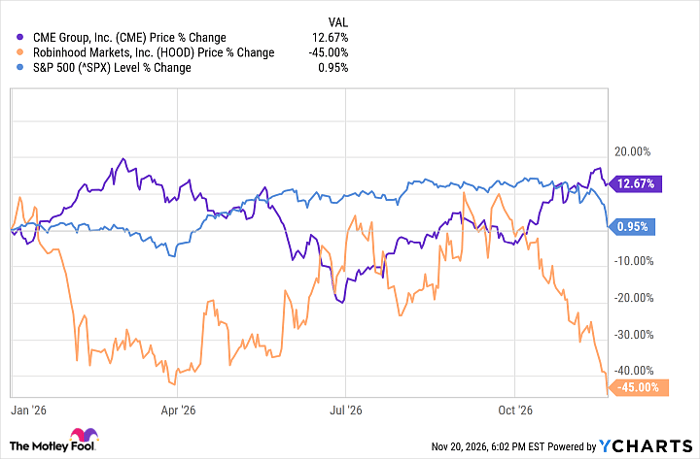
CME data by YCharts
Its stock is also a lot more volatile than CME Group's. Robinhood has seen stronger revenue growth recently, but CME posts a consistently higher profit margin. (This chart's a little wonky because Robinhood didn't go public until 2021.)
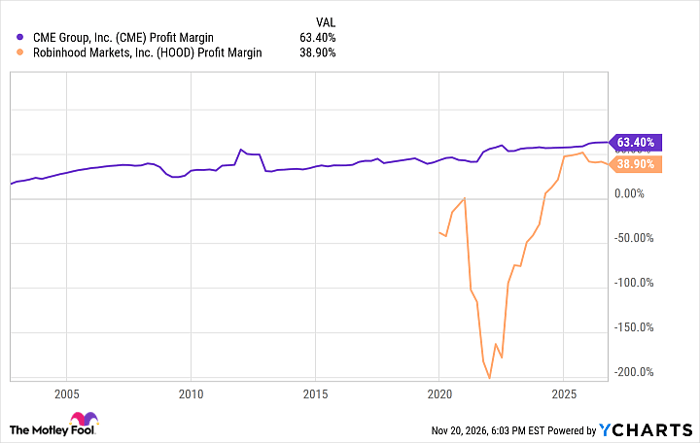
CME Profit Margin data by YCharts
In addition to CME's better profitability, I like that it pays a modest dividend yielding about 1.7%.
I think in a somewhat unsettled market like the one we're currently experiencing, a mature, established operator looks like a more attractive stock. Some investors may prefer growth over consistency, in which case, Robinhood may be more appealing. But for me, CME Group gets my vote for 2027 and beyond.
Should you buy stock in CME Group right now?
Before you buy stock in CME Group, consider this:
The Motley Fool Stock Advisor analyst team just identified what they believe are the 10 best stocks for investors to buy now… and CME Group wasn’t one of them. The 10 stocks that made the cut could produce monster returns in the coming years.
Consider when Netflix made this list on December 17, 2004... if you invested $1,000 at the time of our recommendation, you’d have $305,941!* Or when Nvidia made this list on April 15, 2005... if you invested $1,000 at the time of our recommendation, you’d have $771,325!*
Now, it’s worth noting Stock Advisor’s total average return is 719% — a market-crushing outperformance compared to 192% for the S&P 500. Don't miss the latest top 10 list, available with Stock Advisor, and join an investing community built by individual investors for individual investors.
See the 10 stocks »
*Stock Advisor returns as of November 21, 2026.
Charles Schwab is an advertising partner of Motley Fool Money. Erin Kennedy has positions in CME Group. The Motley Fool has positions in and recommends Alphabet, Bitcoin, CME Group, and Nasdaq. The Motley Fool recommends Charles Schwab, Flutter Entertainment Plc, Intercontinental Exchange, and Robinhood Markets and recommends the following options: short September 2026 $95 calls on Charles Schwab. The Motley Fool has a disclosure policy.
Recommended Articles


