


Dell Heads Into Tuesday's Earnings 47% Below Its High, With $295.25 the Floor to Watch
TradingKey - Dell Technologies (NYSE: DELL) reports fiscal third-quarter results after the US market close on Tuesday, November 24, with its conference call at 3:30 pm Central time. The stock goes into the report under heavy pressure, ending Thursday, November 19, at $312.54, about 9% below the previous Friday's close of $344.53 and roughly 47% below its 52-week high of $595.51, according to Dell's investor relations site.
The slide has had little to do with Dell itself. AI hardware stocks sold off hard in November on worries about data center spending, regulation and export rules, and Dell's own guidance still points to revenue growth of about 80% this quarter. That gap between falling shares and rising forecasts is what Tuesday's report has to resolve.
A Volatile Month With No Company News
Dell's swings this month have been large, even by AI-stock standards. According to Dell's price history, the stock fell 14.89% on November 5, jumped 11.75% on November 11 after CoreWeave's results eased fears about AI spending, and then dropped 7.18% on November 13 and 6.96% on November 16. Trefis said the November 16 drop was not company-specific, as chip stocks and the Nasdaq slid together.
This week added more pressure on the group. Nvidia beat estimates and raised its outlook on Tuesday, November 17, but its shares fell to a new 52-week low by Thursday on leadership and export concerns, and AMD fell 7.72% on Thursday after a short report. New US license rules for advanced chips shipped to Singapore, Malaysia, Indonesia, Thailand and Brazil also took effect on Thursday.
Notice what did not happen, though. Dell barely moved on Thursday, slipping just 0.18% while AMD fell nearly 8% and Nvidia hit a new low. After a run of large daily drops, that may suggest selling in Dell was starting to slow.
What Dell Expects for the Quarter
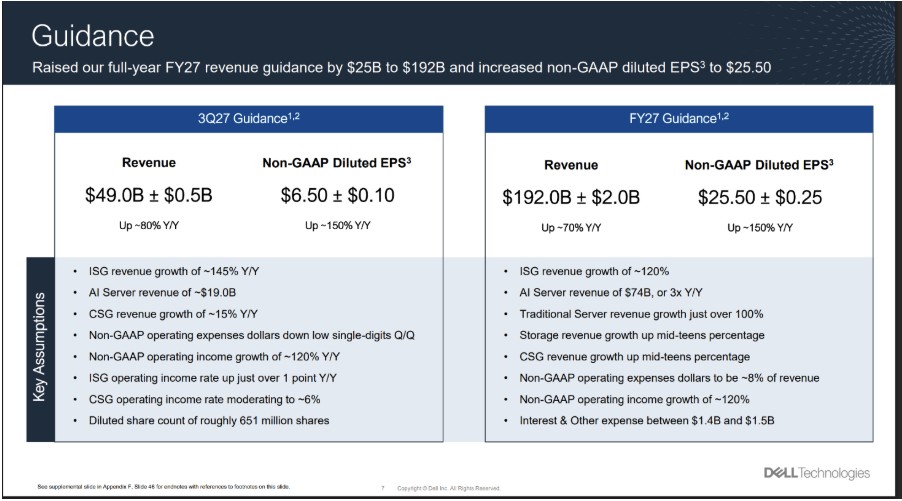
Dell set a high bar in September. It guided third-quarter revenue to $49.0 billion, plus or minus $0.5 billion, up about 80% from a year earlier, and non-GAAP EPS, which excludes one-time items, to $6.50, plus or minus $0.10, up about 150%. It expects AI server revenue of about $19.0 billion, up from $16.4 billion in the second quarter.
Source: Dell Q2 FY27 Performance Review, September 1, 2026 (investors.delltechnologies.com)
For the full fiscal year, Dell raised its revenue outlook by $25 billion to $192 billion, plus or minus $2 billion, and its non-GAAP EPS outlook to $25.50. It now expects AI server revenue of $74 billion, about three times last year's level. Whether it reaffirms or raises those targets will likely matter more than the quarter itself.
The Second Quarter Set the Baseline
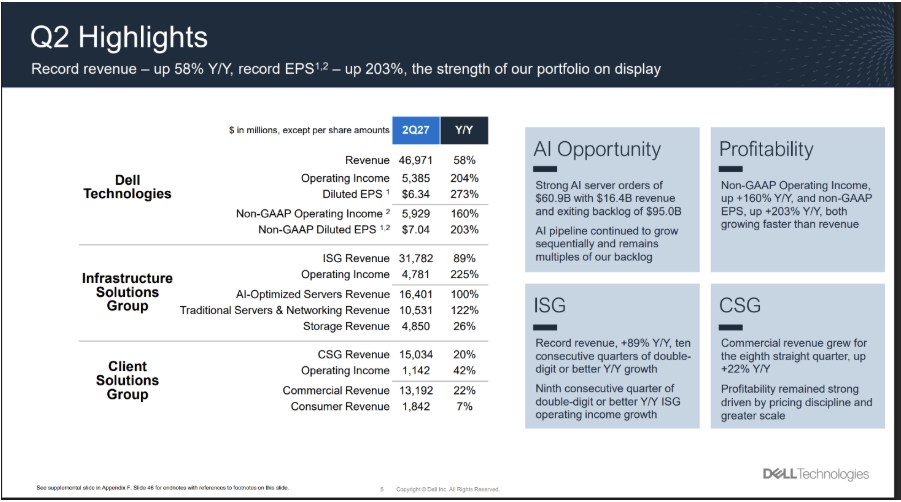
Dell's last report was its strongest yet. Second-quarter revenue rose 58% to a record $46.97 billion, and non-GAAP EPS rose 203% to $7.04. AI server orders reached $60.9 billion, with $16.4 billion of AI server revenue, and the AI backlog, orders not yet shipped, ended the quarter at $95.0 billion. Infrastructure Solutions Group revenue, which includes servers and storage, rose 89% to $31.78 billion, with an operating margin of about 15.0%.
Source: Dell Q2 FY27 Performance Review, September 1, 2026 (investors.delltechnologies.com)
The weak spot was cash. Cash flow from operations fell 73% from a year earlier to $2.2 billion in the second quarter, according to Dell's presentation, even as it returned a record $4.3 billion to shareholders. Investors will want to see whether the $95 billion backlog turns into cash, not just revenue.
Next Week's Calendar and What to Watch
Next week is short. Dell reports on Tuesday after the close, US markets are closed on Thursday, November 26, for Thanksgiving, and Friday trading ends early at 1:00 pm Eastern time. Thin holiday trading could make the post-earnings move larger than usual.
The key numbers are revenue against the $49.0 billion guide, AI server revenue against $19 billion, new AI orders against $60.9 billion and the backlog against $95 billion. Investors will also watch margins in the server business, any comments on the new export license rules, and whether the $192 billion full-year outlook moves higher.
At $312.54, Dell trades at about 12.3 times the midpoint of its full-year non-GAAP EPS guidance, by my calculation. Analysts' average target is about $590, according to StockAnalysis, but most of those targets were set before the selloff, so revisions after the report are likely.
Dell Technical Analysis: Daily Close Below $295.25 Could Open $258.00
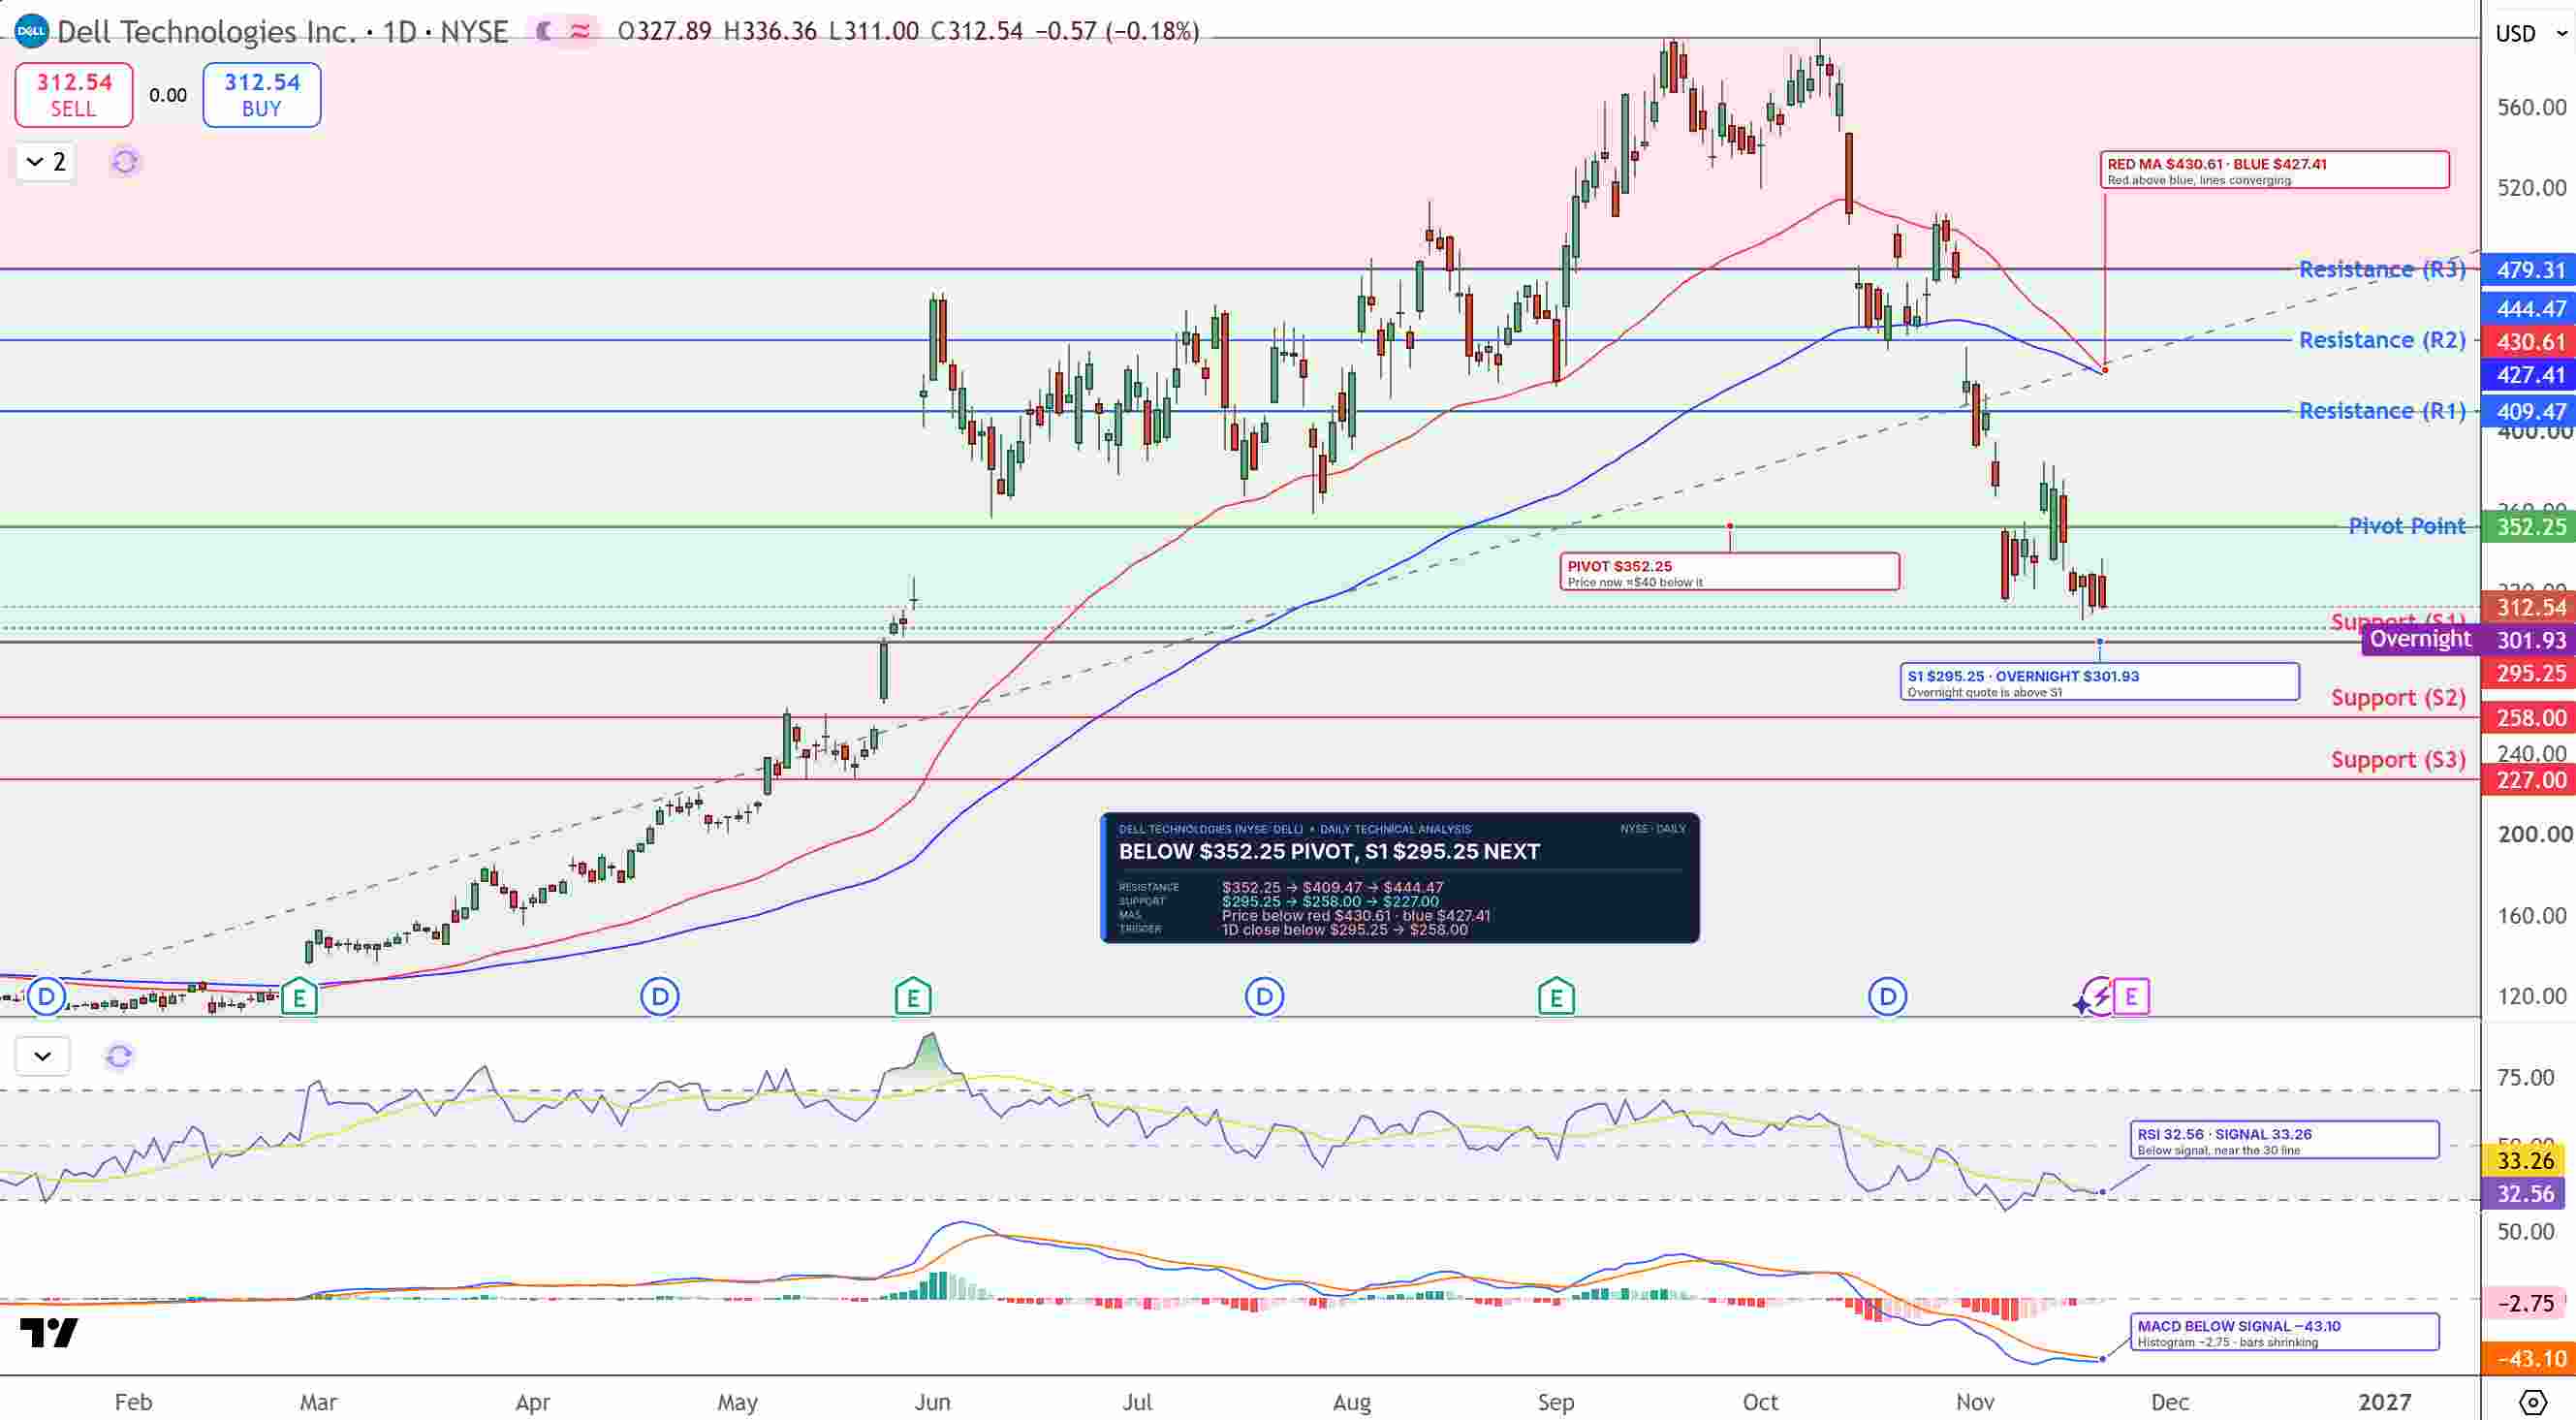
The daily chart shows how steadily the stock has fallen since its autumn peak. Sellers pushed it below the $352.25 pivot and the rising trendline, a line drawn under its higher lows, that had supported the rally all year. The red moving average at $430.61 is now curling down toward the blue one at $427.41, a bearish signal. Moving averages track the average price over recent sessions.
RSI, a momentum gauge that runs from 0 to 100, has dropped to about 33, close to the oversold level of 30. The MACD, another momentum indicator, is deeply negative, but its bars are shrinking, so selling pressure may be easing.
DELL Price Chart - Source: Tradingview
The stock is closing in on $295.25 support. A daily close below it could send DELL toward $258.00, followed by $227.00. For buyers, a daily close back above $352.25 would be the first sign of recovery.
I'm bearish while DELL stays below $352.25, and $295.25 is the key floor going into the report.
Key Levels
- Support: $295.25, $258.00, $227.00
- Resistance: $352.25, $427.41, $430.61
- RSI: 32.56
- Bullish trigger: Daily close above $352.25
- Bearish trigger: Daily close below $295.25
FAQs
When does Dell report Q3 fiscal 2027 earnings?
Dell reports third-quarter fiscal 2027 results after the US market close on Tuesday, November 24, with a conference call at 3:30 pm Central time. It has guided revenue to about $49.0 billion and non-GAAP EPS to about $6.50.
What is the Dell stock forecast before earnings?
The bias is bearish while DELL stays below $352.25. A daily close below $295.25 could send the stock toward $258.00 and $227.00, while a daily close back above $352.25 would be the first sign of recovery.
Bottom Line
Dell's guidance still points to rapid AI-driven growth, but the stock has fallen almost by half as investors question the AI hardware trade. The level that matters is $295.25. In my view, a strong report with a higher full-year outlook could defend that floor, while a daily close below it would open the way toward $258.00.
Recommended Articles


