

Disney Shares Near Multi-Year High of $126 as Strong Earnings and Technicals Signal Potential Breakout from Four-Year Trading Range

Source Tradingkey

TradingKey - Disney (DIS) shares approached multi-year highs near $126 following the release of its fourth-quarter fiscal 2026 earnings report. Market confidence was underpinned by expanding streaming profitability, concurrent growth across theme parks and sports, and an upbeat outlook for earnings and shareholder returns in the next fiscal year.

For the fourth fiscal quarter ended October 3, Disney reported revenue of $25.947 billion, up 16% year-over-year and exceeding market expectations of $25.18 billion. Adjusted earnings per share rose 59% year-over-year to $1.77, also beating estimates. Total segment operating income reached $4.970 billion, up 43% year-over-year and surpassing the company's prior guidance of $4.9 billion.

The improvement in profitability was also reflected in cash flow, with quarterly free cash flow rising 89% year-over-year to $4.837 billion, providing support for subsequent content investments, business expansion, and share repurchases.

The subscription video-on-demand (SVOD) business, which includes Disney+ and Hulu, was the most prominent source of earnings growth this quarter. Revenue from the segment rose 19% year-over-year to $6.050 billion, while operating income surged 105% to $824 million, with operating margin expanding from 7.9% to 13.6%. The key factor behind this shift was revenue growth outpacing cost growth. Driven by subscriber expansion and higher effective pricing, subscription revenue rose 22% year-over-year; meanwhile, operating costs and expenses increased by only 12% over the same period, allowing content and platform investments to be spread across a larger revenue base.

Shareholder returns provided another pillar of support. The company plans to repurchase $9 billion in stock in fiscal 2027 and raised its annual dividend by 33% to $2 per share. Beyond earnings growth, share repurchases reduce the share count and are also expected to provide further support for earnings per share.

For a stock price trading near multi-year highs, the earnings report provided two key pillars of support: profits and cash flows from existing operations are improving, and the company is willing to return capital to shareholders through larger-scale repurchases and dividends. In the next phase, whether streaming profit expansion can be sustained and whether new investments in content and theme parks yield commensurate returns will influence the valuation the market is willing to assign.

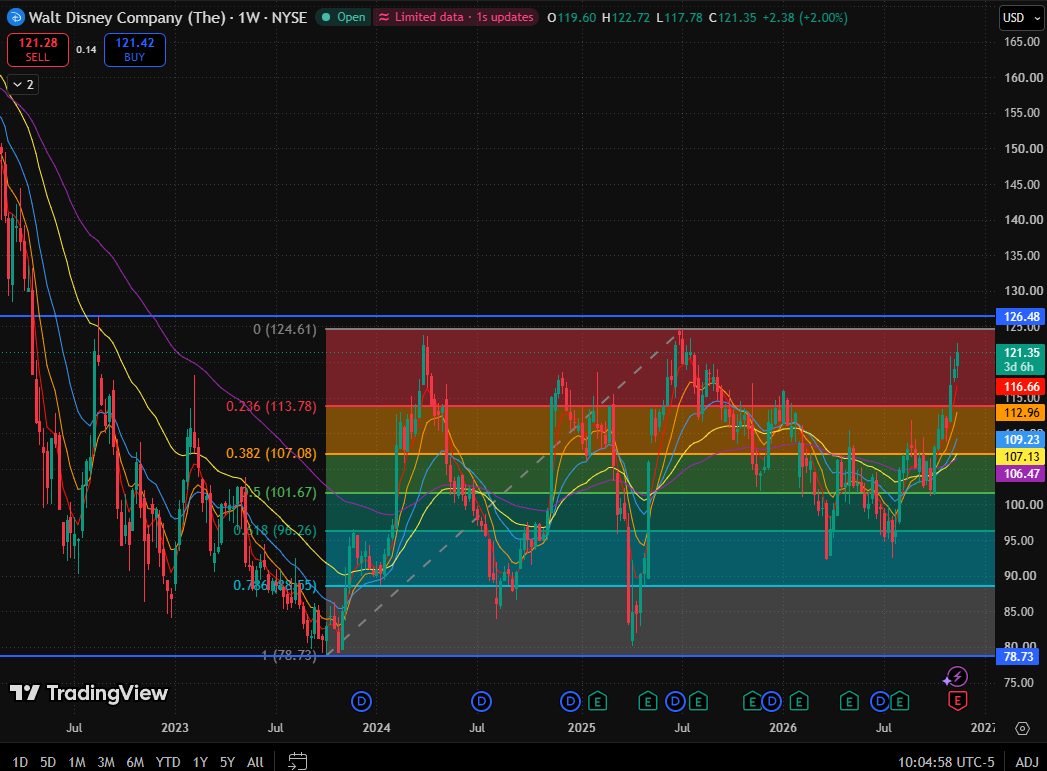
From a technical perspective, Disney's weekly recovery continues to advance, approaching a multi-year resistance zone of $124.61–$126.48.
8-36a2340daf7a4f9f8ac35f56cbc444f2

Disney Weekly Stock Chart, Source: TradingView

From a trend and structural perspective, both upward rallies in 2024 and 2025 met resistance near $125 and subsequently pulled back significantly. The current rally has once again approached the same zone, shifting the analytical focus from a bottom recovery to testing prior highs. While recent strength has improved its positioning within the range, the long-term consolidation pattern has yet to be broken.

Going forward, only if the weekly close holds firmly above $126.48, followed by a pullback to the $124.61–$126.48 area that finds buying support, would it help confirm a breakout from the long-term range.

If the weekly price breaks below $113.78 and fails to reclaim it on a rebound, the upward structure pushing toward prior highs would weaken significantly. Major support below lies in the $106.47–$109.23 range.

Disclaimer: For information purposes only. Past performance is not indicative of future results.
placeholder
Gold Price Analysis Today | Forex Gold Analysis | XAU/USD Analysis - November 11, 2026Get the latest gold price analysis, forex gold insights, and XAU/USD analysis for November 11, 2026. Read on for the details.
Author  Mitrade
Nov 11, Wed
Get the latest gold price analysis, forex gold insights, and XAU/USD analysis for November 11, 2026. Read on for the details.
placeholder
Anthropic is six times oversubscribed at $1.4 trillion while Nvidia is down 32% — the AI trade has two pricesAnthropic lists on Nasdaq as ANT on Thursday at $70 ~ $78 a share, raising up to $64.4 billion at a target valuation near $1.4 trillion, and the book is reportedly six times covered. In the same six weeks, Nvidia has fallen 32% and the QQQ is 10.9% below its October peak. Private capital and public markets are marking the same AI complex at two very different prices. This piece separates the two books: what the S-1 shows, who is anchoring the $26 billion private placement, and what Thursday's debut would have to do to change the public tape.
Author  Irene Q.
Yesterday 02: 27
Anthropic lists on Nasdaq as ANT on Thursday at $70 ~ $78 a share, raising up to $64.4 billion at a target valuation near $1.4 trillion, and the book is reportedly six times covered. In the same six weeks, Nvidia has fallen 32% and the QQQ is 10.9% below its October peak. Private capital and public markets are marking the same AI complex at two very different prices. This piece separates the two books: what the S-1 shows, who is anchoring the $26 billion private placement, and what Thursday's debut would have to do to change the public tape.
placeholder
Gold Price Analysis Today | Forex Gold Analysis | XAU/USD Analysis - November 16, 2026Get the latest gold price analysis, forex gold insights, and XAU/USD analysis for November 16, 2026. Read on for the details.
Author  Mitrade
Yesterday 02: 45
Get the latest gold price analysis, forex gold insights, and XAU/USD analysis for November 16, 2026. Read on for the details.
placeholder
Weekly Report: DXY 103.41, 10-year 5.15%, AUD carry 3bp — three FX regimes flipped in one weekThe dollar index rose 1.09% to 103.41, a 19-month high, while the US 10-year closed at 5.154% and the Australia-US two-year spread collapsed to about 3 basis points from 36. EURUSD fell 1.59% to 1.1024, USDJPY rose 1.51% to 159.78 and AUDUSD fell 1.79% to 0.6764, a 10-month low. Three FX regimes — the broad dollar, the US rate level and the Australian carry premium — flipped in the same week. This report marks the thresholds, ranks which one can flip back first, and lists the week's calendar.
Author  Irene Q.
Yesterday 03: 26
The dollar index rose 1.09% to 103.41, a 19-month high, while the US 10-year closed at 5.154% and the Australia-US two-year spread collapsed to about 3 basis points from 36. EURUSD fell 1.59% to 1.1024, USDJPY rose 1.51% to 159.78 and AUDUSD fell 1.79% to 0.6764, a 10-month low. Three FX regimes — the broad dollar, the US rate level and the Australian carry premium — flipped in the same week. This report marks the thresholds, ranks which one can flip back first, and lists the week's calendar.
placeholder
Gold Price Analysis Today | Forex Gold Analysis | XAU/USD Analysis - November 17, 2026Get the latest gold price analysis, forex gold insights, and XAU/USD analysis for November 17, 2026. Read on for the details.
Author  Mitrade
10 hours ago
Get the latest gold price analysis, forex gold insights, and XAU/USD analysis for November 17, 2026. Read on for the details.
goTop
quote