


Intel Shareholders Sue as INTC Slides 7% Toward $51.83 Support
TradingKey - Intel (NASDAQ: INTC) fell 7.02% to $55.47 on Monday, November 16, from Friday's $59.66, and overnight trading points slightly lower at $54.53. The drop came as chip stocks sold off ahead of Nvidia's earnings and news spread of a shareholder lawsuit filed on Friday.
The stock is now about 40% below its October 29 close of $92.07, before its third-quarter report, and about 61% below its June 30 record of $142.35. Even so, by my calculation, it remains up about 50% this year, a reminder of how far it ran before the October crash.
The Lawsuit Targets the $95 Stock Sale
The proposed class action was filed in federal court in San Jose, California, led by the City of Southfield Fire and Police Retirement System, a Michigan pension fund. It names Intel, CEO Lip-Bu Tan and CFO David Zinsner and covers investors who bought shares between July 23 and October 29, 2026.
The complaint alleges that Intel was too slow to disclose how slowing PC sales and an inventory glut would hurt revenue. It argues that Intel had a motive because it sold $23 billion of stock at $95 a share in mid-August, during the third quarter, to fund its contract manufacturing business. The plaintiffs are seeking unspecified damages, and Intel did not immediately respond to requests for comment. The claims have not been proven in court. Intel now trades about 42% below that $95 sale price.
The October Crash Still Hangs Over the Stock
On October 30, Intel shares fell 28.6%, wiping out about $140 billion of market value, after the company's fourth-quarter outlook came in far below expectations. The third quarter itself was solid. Revenue rose 21% to $16.51 billion, adjusted EPS of $0.52 beat the roughly $0.40 estimate, and Data Center and AI revenue jumped 78% to $7.32 billion, the segment's strongest growth in 15 years.
The problem was what came next. Intel guided fourth-quarter revenue to $15.0 billion to $16.0 billion, against about $17.07 billion expected, according to LSEG, and adjusted EPS to about $0.25, against a $0.43 consensus. It also expects the adjusted gross margin, the share of revenue left after production costs, to fall to 38% from 44.1%. A shortage of memory chips has pushed up PC prices and hurt demand, and Intel expects PC client revenue to drop more than 20% from the third quarter. Zinsner said Intel does "not expect a sustained recovery until memory availability improves and pricing begins to normalize."
An explosion on October 14 also shut Fab 28, Intel's plant in Kiryat Gat, Israel. Management expects it to cut about $300 million from fourth-quarter revenue, with a similar hit in the first quarter of 2027.
Strong Data Center Demand Has Not Stopped the Slide
The data center business is still growing quickly, yet the stock keeps falling, because investors are focused on the PC slump, thin margins and cash. Intel ended the third quarter with about $54 billion in cash and short-term investments after the stock sale, but it expects capital spending to rise significantly in 2027 and does not expect positive free cash flow, the cash left after capital spending, next year.
On the manufacturing side, Intel Foundry lost $1.85 billion in the third quarter, and only $411 million of its revenue came from outside customers. Tesla said in April that it plans to use Intel's upcoming 14A manufacturing process, a win for the foundry plan, though no terms were disclosed. Management's goal is for Intel Foundry to reach operating breakeven by late 2028.
Monday added more pressure from outside. The Nasdaq 100 fell about 2.7% as chip stocks sold off before Nvidia's results, and Intel and Micron fell more than Nvidia itself.
Intel Technical Analysis: Daily Close Below $51.83 Could Open $40.89
That weakness shows clearly on the daily chart. The stock's recent bounce stalled right at $64.03, and sellers have now pushed it back toward $51.83, the early-November low. The bigger picture is bearish. The post-earnings gap broke both the rising trendline from early 2026, a line drawn under its higher lows, and the $84.90 support zone. The red moving average at $85.04 is also crossing below the blue one at $90.64, a bearish signal, since moving averages track the average price over recent sessions.
RSI, a momentum gauge that runs from 0 to 100, sits near 30, in oversold territory, where selling is often seen as stretched. The MACD, another momentum indicator, is still negative, but its bars are shrinking, so selling pressure may be easing.
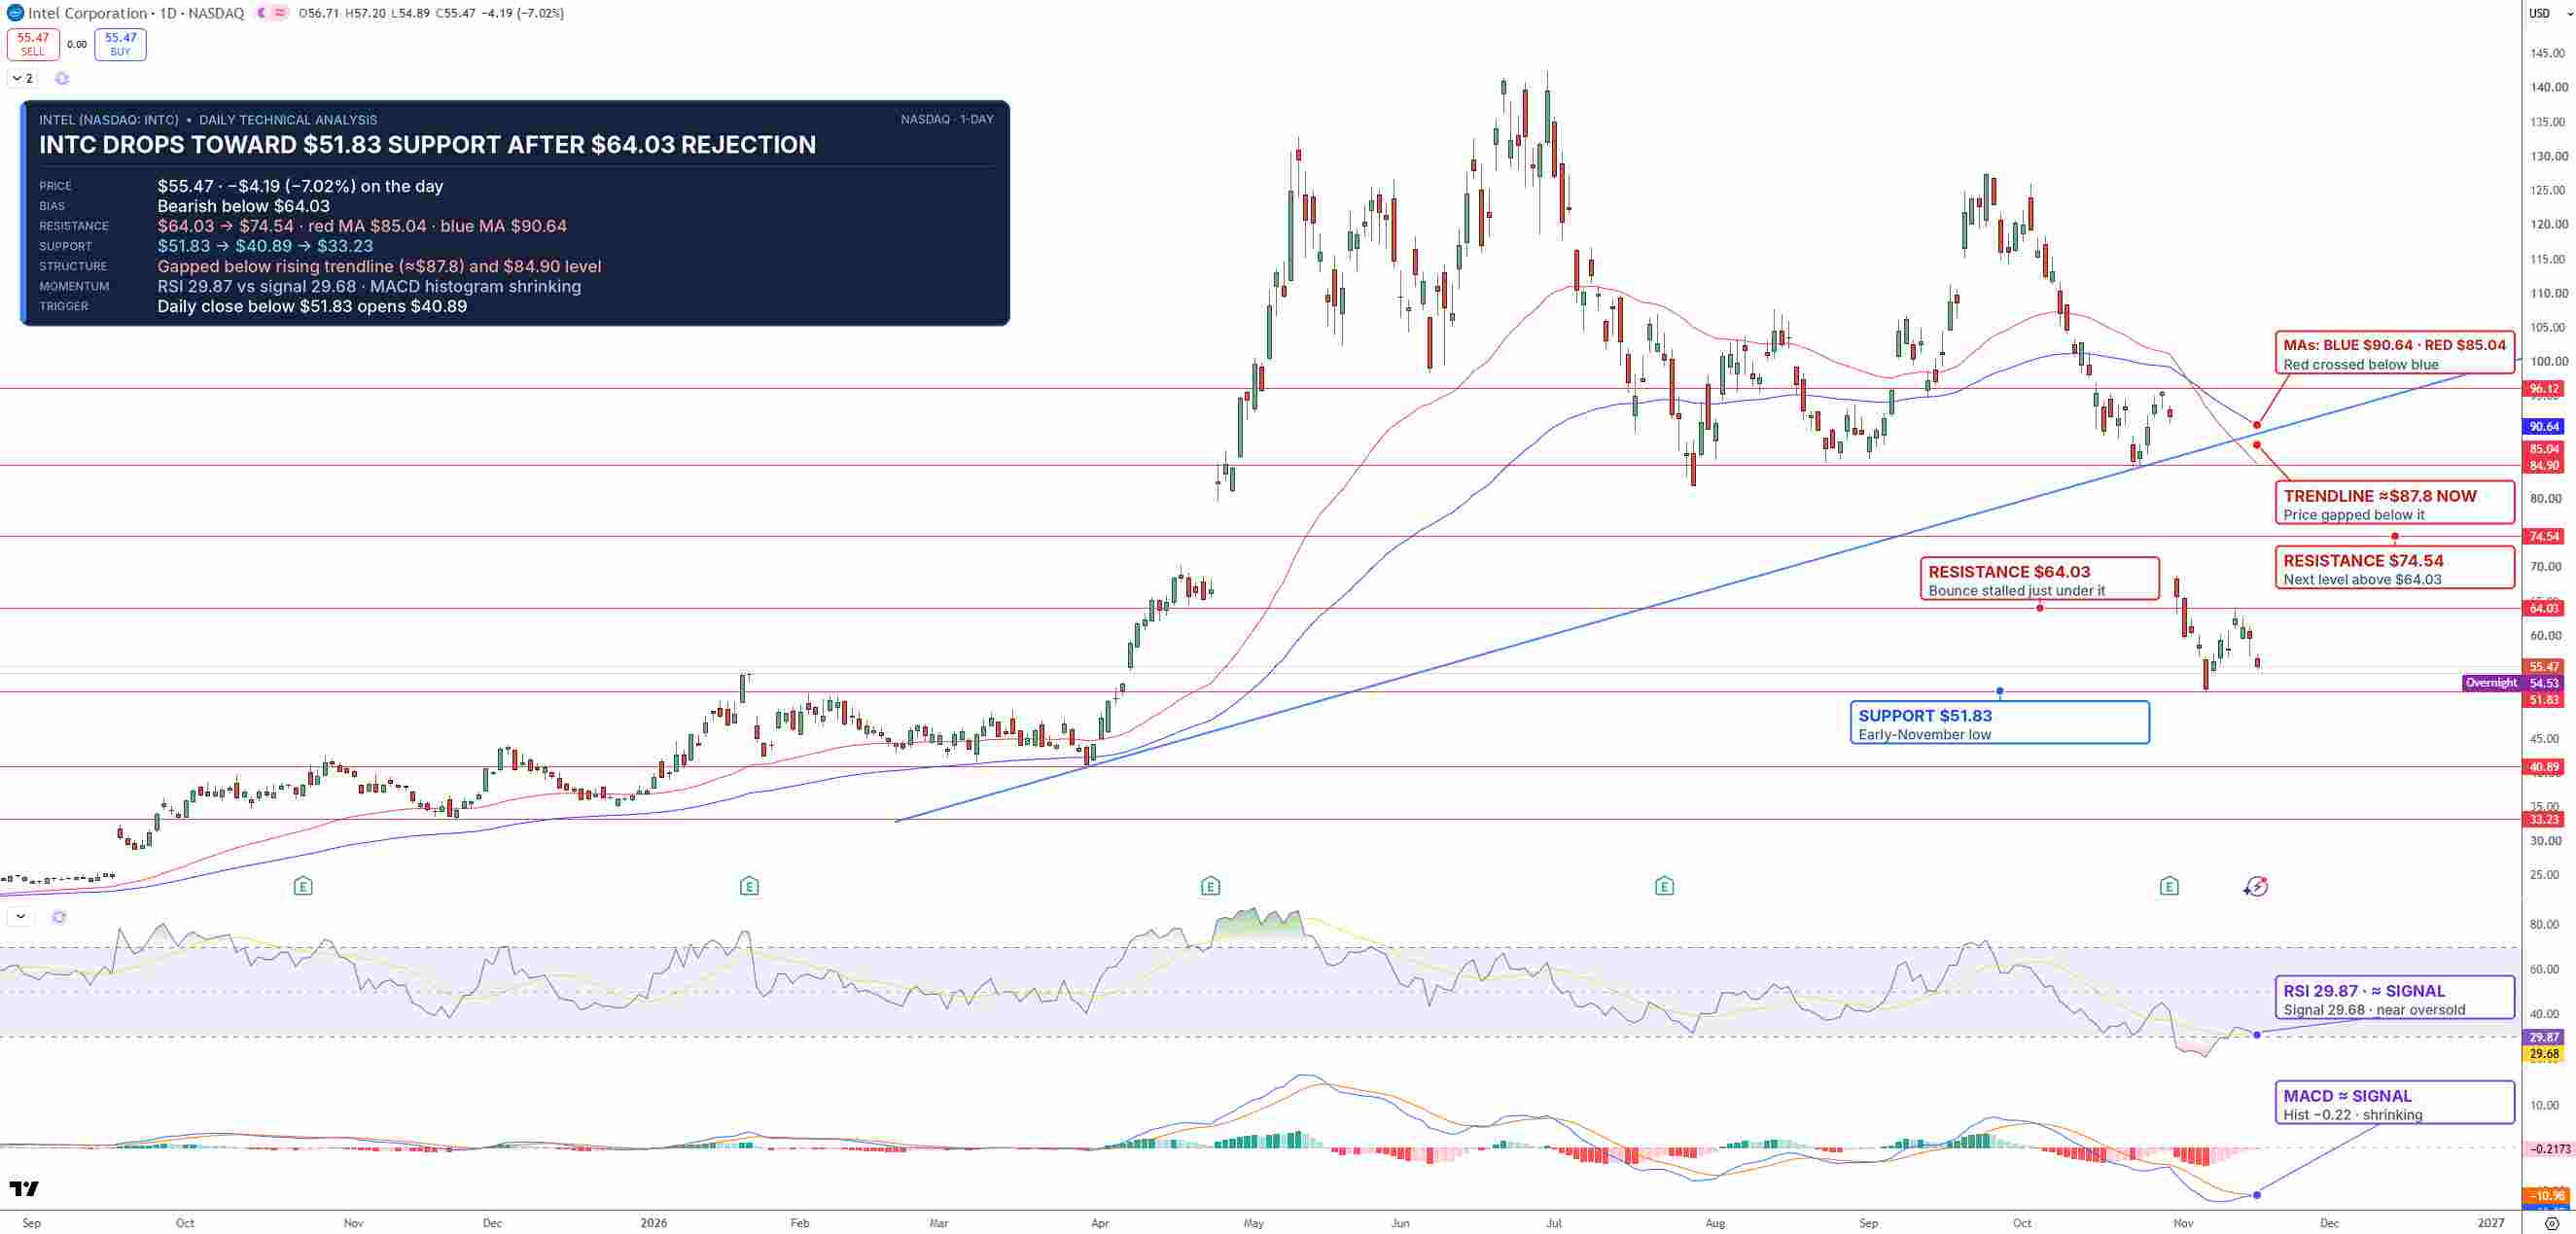
INTC Price Chart - Source: Tradingview
A daily close below $51.83 could send INTC toward $40.89, followed by $33.23. For buyers, a recovery above $64.03 would be the first sign of relief, opening $74.54.
I'm bearish while INTC stays below $64.03, with $51.83 as the key floor.
Key Levels
- Last close: $55.47, down 7.02% on Monday, November 16 (overnight: $54.53)
- Support: $51.83, $40.89, $33.23
- Resistance: $64.03, $74.54
- RSI: 29.87
- Bullish trigger: Daily close above $64.03
- Bearish trigger: Daily close below $51.83
FAQs
Why are Intel shareholders suing the company?
A proposed class action filed in San Jose alleges Intel was too slow to disclose how weak PC sales and excess inventory would hurt revenue, while it sold $23 billion of stock at $95 a share in August. Intel did not immediately comment, and the claims have not been proven.
What is the Intel stock forecast now?
The bias is bearish while INTC stays below $64.03 on the daily chart. A daily close below $51.83 could send the stock toward $40.89 and $33.23, while a recovery above $64.03 would open $74.54.
Bottom Line
Intel's data center growth is real, but the PC slump, a weak fourth-quarter guide and now a shareholder lawsuit keep the pressure on. The level that matters is $51.83. In my view, a daily close below it would extend the downtrend toward $40.89, while a move back above $64.03 would be the first sign that selling is running out.
Recommended Articles


