


Apple Sets a Record Close at $356.27 as Tech Sells Off, and AAPL Now Eyes $363.34
TradingKey - Apple (NASDAQ: AAPL) rose 0.39% to a record close of $356.27 on Friday, November 13, after setting an all-time intraday high of $360.83. Overnight trading is slightly higher at $357.13, and the stock is up about 31% this year, with a market value of about $5.2 trillion, the largest of any company.
The record came less than two weeks after a disappointing margin forecast sent the stock lower. From the $328.81 after-hours low on November 2, Apple has gained about 8%, by my calculation, while much of the technology sector has moved the other way.
Apple Held Up While Tech Sold Off
The Vanguard Information Technology ETF fell about 12% from the start of October to November 11, according to the Motley Fool, largely because of a slide in Nvidia and doubts about how long the AI spending boom can last. Nvidia's troubles deepened on November 12, when Jensen Huang resigned as CEO.
Apple has held up partly because it is not spending heavily on AI data centers. In fiscal 2026, it generated about $136 billion of free cash flow, the cash left after running the business and paying for new equipment, with only about $9 billion of capital spending. That makes it look safer to investors who worry that other tech giants are spending too much on AI before the returns show up.
The Quarter Beat, but the Margin Guide Hurt First
On November 2, Apple reported fiscal fourth-quarter revenue up 12% to a September-quarter record of $114.5 billion. EPS rose 14% to $2.10, above the roughly $1.99 estimate, though tariff refunds added $0.05. iPhone revenue rose 17% to $57.6 billion, and Services grew about 10% to a record $31.6 billion. Fiscal 2026 revenue reached a record $479 billion.
Apple guided December-quarter revenue growth of 7% to 10%, above the roughly 5.9% FactSet consensus, which would make it the biggest quarter in the company's history. But it guided gross margin, the share of revenue left after production costs, to 45% to 46%, below the roughly 47% Bloomberg estimate and down from 47.9% in the fourth quarter. CEO John Ternus, who took over from Tim Cook at the end of August, said, "What we're seeing with memory pricing right now is unprecedented." The stock fell 2.81% after hours to $328.81.
Why the Margin Scare Faded So Quickly
Memory costs did not go away, and Apple expects them to keep rising beyond the December quarter. Yet the stock did not break down. Instead, it recovered the whole after-hours drop and set new records within two weeks, as investors appeared to decide that strong demand and cash returns outweigh a temporary hit to margins.
On the demand side, the iPhone Duo, Apple's first foldable phone, has been short of supply since launch, and Ternus told Reuters, "Duo is constrained as of today." New products are also reaching stores. HomeView, a $299 smart-home display that recognizes up to six household members by face, and a fourth-generation Apple TV 4K with the A19 chip went on sale on November 13, although HomeView is not sold in the EU because the new Siri AI is not available there.
Apple also generated $28 billion of operating cash flow in the fourth quarter and returned $28 billion to shareholders, and its quarterly dividend of $0.27 a share is paid on Monday, November 16.
Valuation Is the Main Risk
After the rally, the Motley Fool puts the stock at about 36.4 times forward earnings, and GuruFocus estimates a fair value of $298.55, about 20% below Friday's close. That premium leaves little room for disappointment if memory costs push margins lower for longer than expected.
Nvidia's earnings on Tuesday, November 17, are the next test for the trade. A strong report could pull money back into AI stocks and away from safer names like Apple, while a weak one could keep Apple in favor.
Apple Technical Analysis: Daily Close Above $363.34 Could Open $374.89
That shift toward Apple shows clearly on the daily chart. The stock has finally pushed above $349.14, a ceiling that capped rallies through October and early November. The uptrend looks healthy, with steady higher lows along a rising trendline from July, a line drawn under those higher lows. AAPL also holds well above both of its moving averages, which track the average price over recent sessions, at $338.07 and $326.55.
RSI, a momentum gauge that runs from 0 to 100, sits near 61, above its signal line. The MACD, another momentum indicator, has turned positive with a fresh bullish crossover, which confirms that buyers are in control.
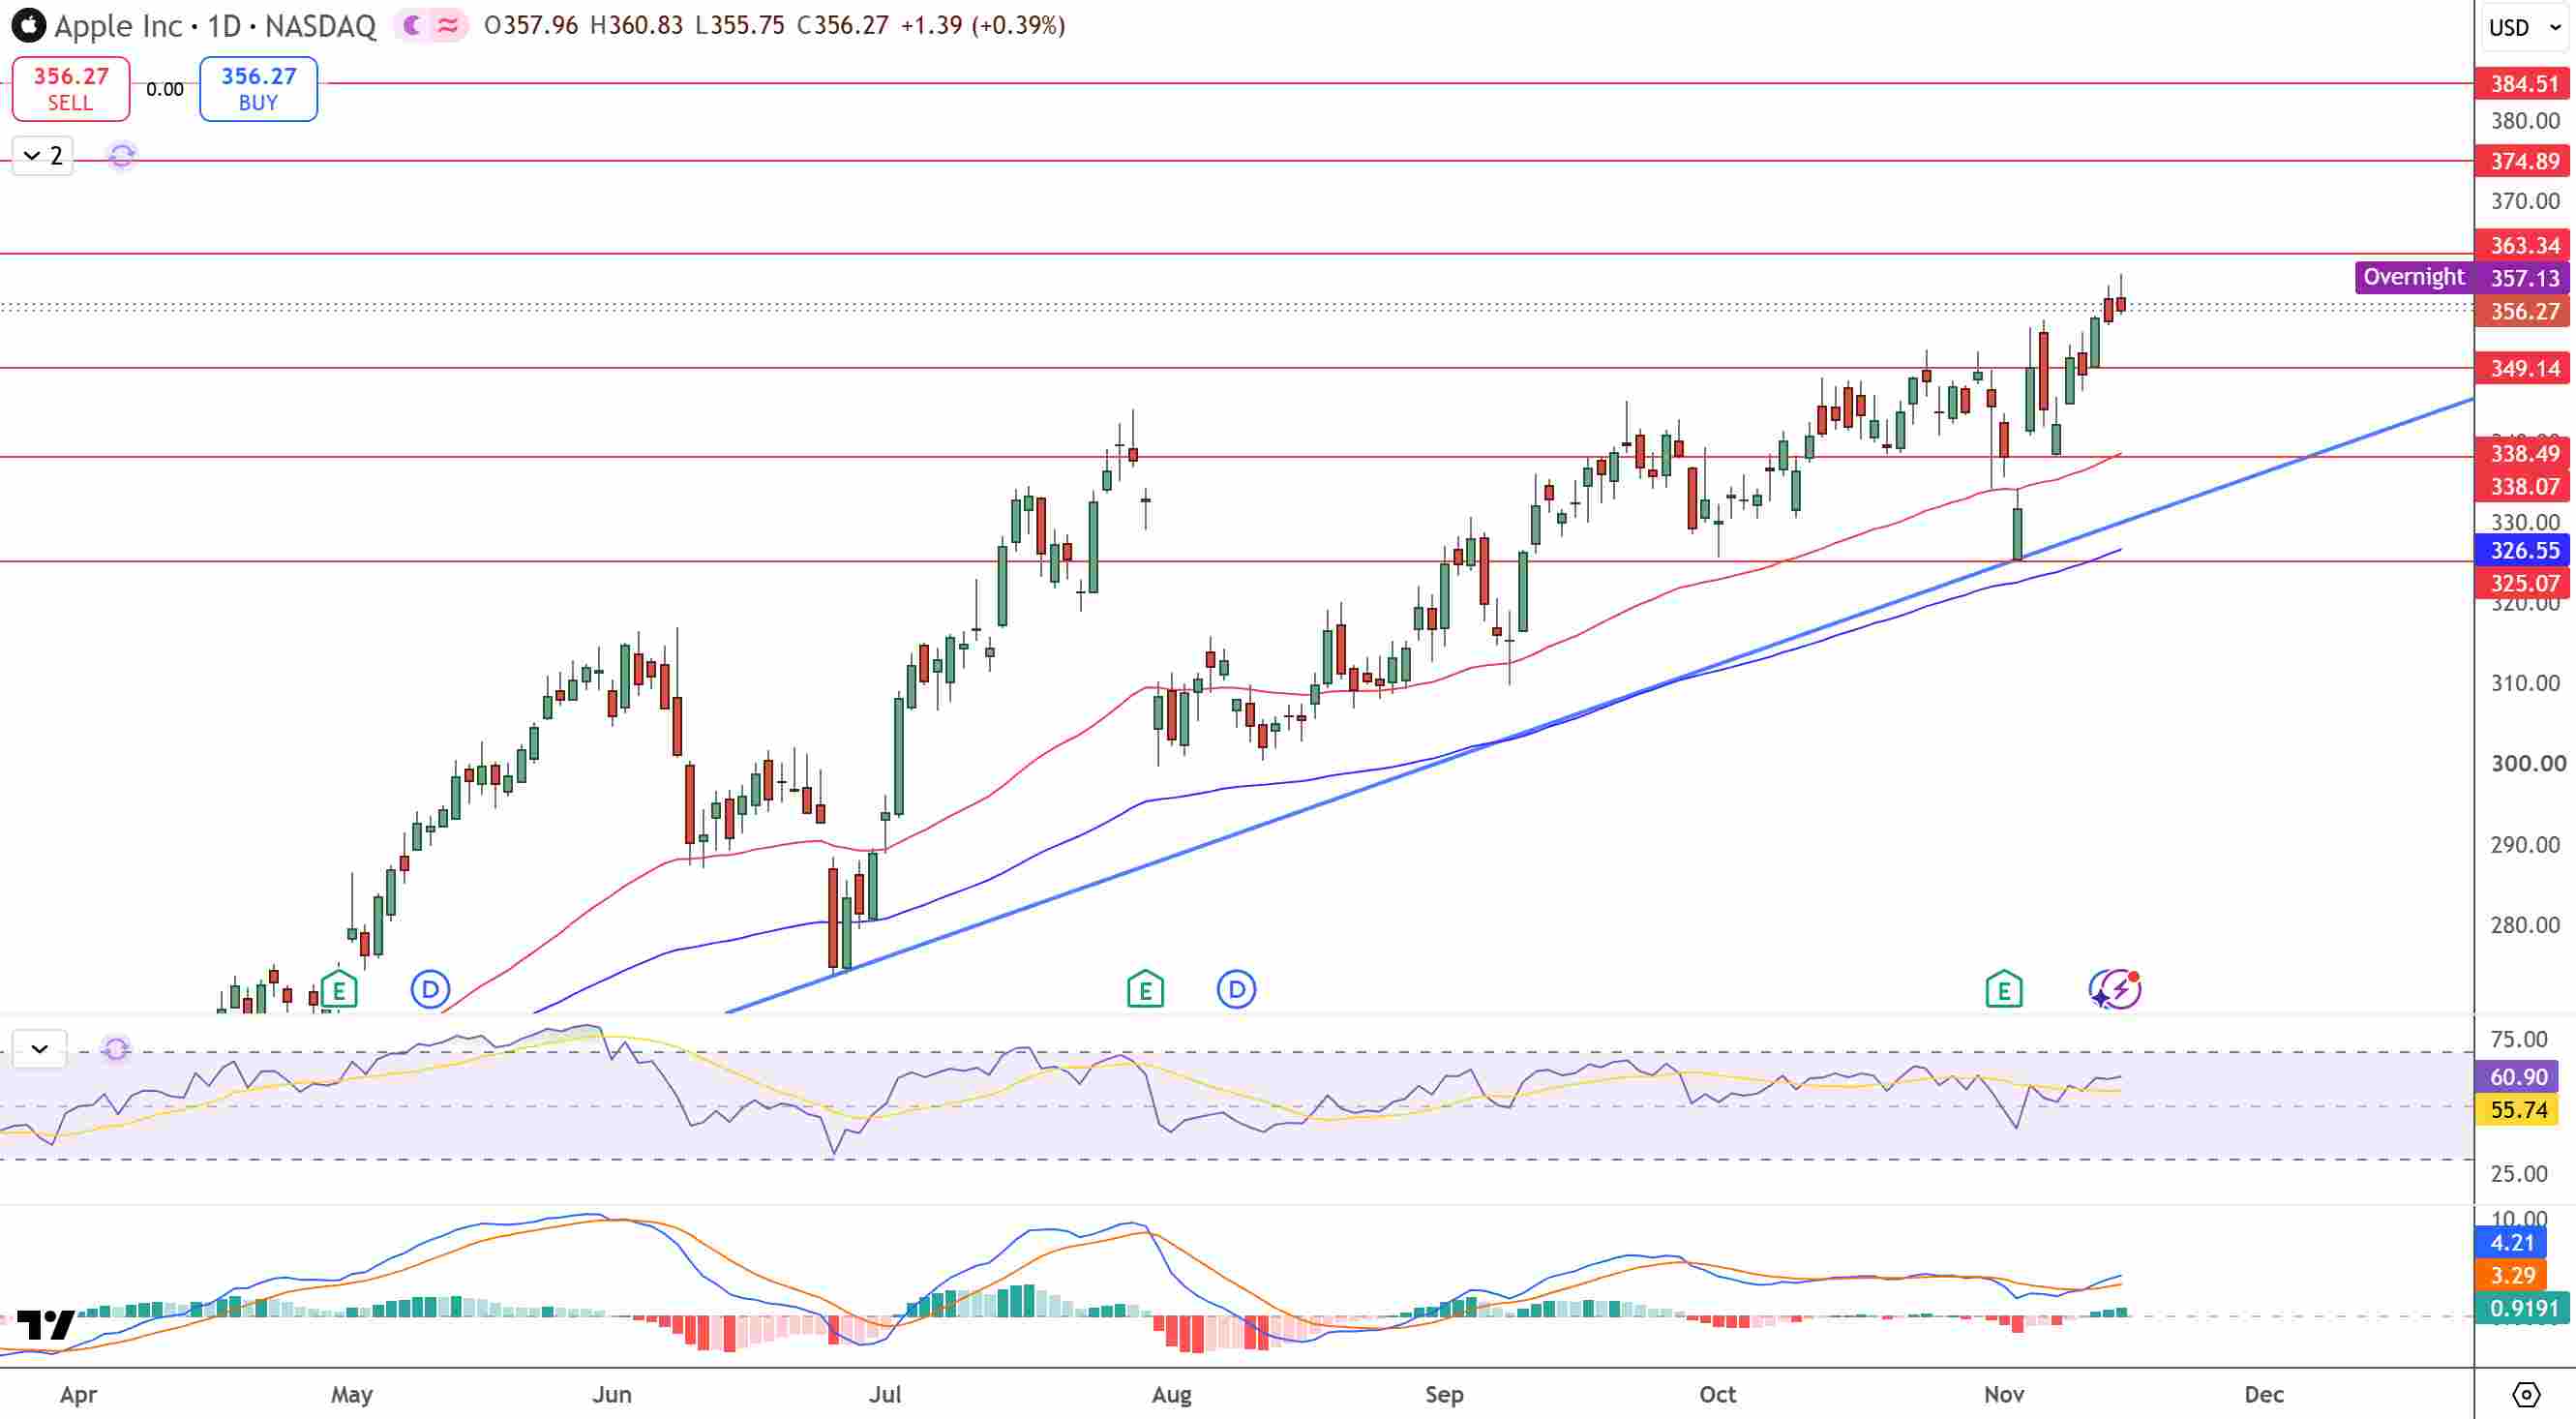
AAPL Price Chart - Source: Tradingview
The next hurdle is $363.34, just above Friday's record intraday high. A daily close above it could open $374.89, followed by $384.51. On the downside, $349.14 is now key support, and a close back below it could send AAPL toward $338.49.
I'm bullish while AAPL holds above $349.14, with $363.34 as the next target.
Key Levels
- Last close: $356.27, up 0.39% on Friday, November 13 (overnight: $357.13)
- Support: $349.14, $338.49
- Resistance: $363.34, $374.89, $384.51
- RSI: 60.90
- Bullish trigger: Daily close above $363.34
- Bearish trigger: Daily close below $349.14
FAQs
Why is Apple stock at a record high while tech falls?
Investors see Apple as a safer tech stock because it generated about $136 billion of free cash flow in fiscal 2026 without heavy AI data center spending, and demand for the iPhone Duo remains strong despite a weaker margin outlook.
What is the Apple stock forecast now?
The bias is bullish while AAPL holds above $349.14, the old ceiling that now acts as support. A daily close above $363.34 could open $374.89 and $384.51, while a close below $349.14 could send the stock toward $338.49.
Bottom Line
Apple has turned a margin scare into a record close by offering investors cash flow and steady demand while AI stocks struggle. The level that matters is $349.14. In my view, holding it keeps the path toward $363.34 and $374.89 open, while a daily close back below it would suggest the safe-haven trade is fading.
Recommended Articles


