

AMD Surges 24% in Five Days, Seen Rising Another 15% to Retest $658 Record High

Source Tradingkey

TradingKey - AMD short covering and buying momentum push stock up 24% over five days, with technicals signaling potential for another 15% surge toward all-time highs.

On November 11, Eastern Time, shares of Advanced Micro Devices (AMD) surged over 7% in regular trading and rose another 4% after hours, demonstrating formidable explosive momentum. Benefiting from expanding data center chip market share, continued capex acceleration from cloud hyperscalers, and strong sentiment spillover across the broader semiconductor sector, AMD surged 24% in just five trading sessions, triggering aggressive buying from short-term bulls and setting it up to potentially retest its all-time high of $658.

Following a pullback in semiconductors from October to early November driven by macroeconomic inflation and post-election political and economic noise, AMD became the first sector heavyweight to fully recoup its steep losses. This triggered a powerful confluence of short covering and passive institutional allocation flows, propelled by catalysts from both the broader industry and its competitors.

As major cloud service providers such as Microsoft, Meta, and Oracle actively pursue diversified supply chain strategies to reduce their overreliance on Nvidia as a single supplier, AMD's Instinct AI chip series has captured greater market share in large data centers, driving significant upward revisions to the company's revenue and gross margin forecasts.

A capital substitution effect triggered by an executive leadership crisis at Nvidia (NVDA) has also been a key driver. Recently, as Nvidia was hit by CEO Jensen Huang facing a board investigation and a sharp after-hours plunge, some hedge funds and institutional investors rebalanced their portfolios, partially pulling capital from Nvidia and reallocating it to AMD—the contender with the strongest catch-up potential in the AI chip space—generating a pronounced symmetrical capital rotation.

In addition, the resonance between macroeconomic liquidity and supply chain sentiment has catalyzed AMD's share price advance. With South Korea's semiconductor exports surging by an explosive 331% and CoreWeave reporting a hundred-billion-dollar-scale order backlog, visibility across the entire AI infrastructure supply chain has improved collectively, driving a powerful confluence of short covering and programmatic buying in AMD shares.

Despite the powerful momentum of a 24% five-day rally, retesting the all-time high of $658 will first require overcoming a critical technical and overhead supply resistance zone at $580–$600, where a substantial volume of trapped shares from previous peaks has accumulated. As the stock approaches this zone, it will inevitably face the release of break-even selling pressure, requiring higher trading volume to complete the turnover.
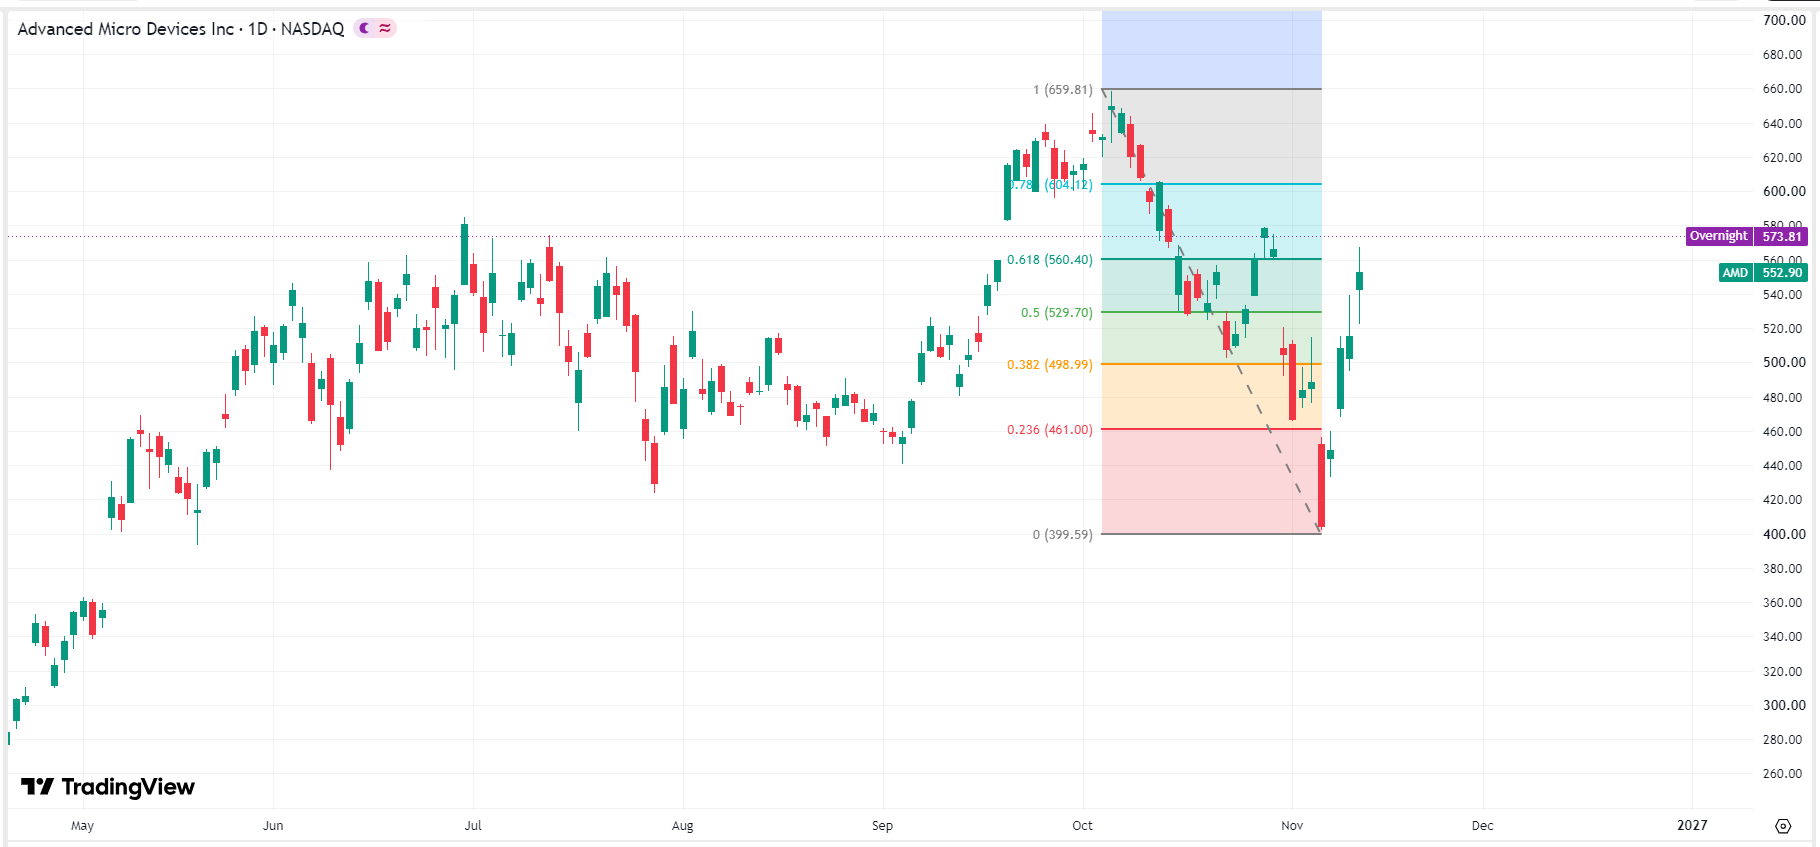
amd-price-9586892c3fb04a8bb3bc1642e25267c6AMD Stock Chart, Source: TradingView

Disclaimer: For information purposes only. Past performance is not indicative of future results.
placeholder
China's factories are pricing in 5.7%. Its shoppers are pricing in 0.7%.China's October PPI rose 5.7% year on year, the fastest since June 2022, while CPI slowed to 0.7% and core CPI to 0.8%. Input prices rose faster than factory-gate prices, squeezing mid-stream margins by roughly five percentage points. The Hang Seng fell 0.13% on a day the S&P 500 rose 2.35%, the only major market to sit out the risk-on session.
Author  Irene Q.
Nov 10, Tue
China's October PPI rose 5.7% year on year, the fastest since June 2022, while CPI slowed to 0.7% and core CPI to 0.8%. Input prices rose faster than factory-gate prices, squeezing mid-stream margins by roughly five percentage points. The Hang Seng fell 0.13% on a day the S&P 500 rose 2.35%, the only major market to sit out the risk-on session.
placeholder
Gold Price Analysis Today | Forex Gold Analysis | XAU/USD Analysis - November 11, 2026Get the latest gold price analysis, forex gold insights, and XAU/USD analysis for November 11, 2026. Read on for the details.
Author  Mitrade
Yesterday 02: 42
Get the latest gold price analysis, forex gold insights, and XAU/USD analysis for November 11, 2026. Read on for the details.
placeholder
Gold Tumbles Toward $4,000 as Hotter-Than-Expected CPI Boosts Fed Rate-Hike Bets, Bulls Eye $3,975 SupportAs of the Asian session on Wednesday (November 11), gold prices (XAUUSD) rebounded slightly after a sharp decline in the previous session, last trading near $4,040, up about 0.3% on the d
Author  TradingKey
Yesterday 02: 51
As of the Asian session on Wednesday (November 11), gold prices (XAUUSD) rebounded slightly after a sharp decline in the previous session, last trading near $4,040, up about 0.3% on the d
placeholder
Core CPI stuck at 0.3% for a third straight month — and BLS couldn't publish the number that would explain itOctober headline CPI rose 0.4% m/m against a 0.3% consensus, and core rose 0.3% for a third consecutive month against 0.2% expected. BLS published no year-on-year figures because October 2025 collection was lost to the government shutdown. Energy cooled to 0.7% from 5.2% — shelter, food and transport services did the rest. The 2-year yield jumped 18 to 21 basis points, the 10-year added 12, and the dollar closed at 102.25.
Author  Irene Q.
Yesterday 03: 09
October headline CPI rose 0.4% m/m against a 0.3% consensus, and core rose 0.3% for a third consecutive month against 0.2% expected. BLS published no year-on-year figures because October 2025 collection was lost to the government shutdown. Energy cooled to 0.7% from 5.2% — shelter, food and transport services did the rest. The 2-year yield jumped 18 to 21 basis points, the 10-year added 12, and the dollar closed at 102.25.
placeholder
Bitcoin lost its 200-day average — but the exit started three sessions before the CPIBitcoin fell 2.5% to about $73,400 on 11 November, an 11-week low, breaking its 200-day moving average near $73,100. The 24-hour liquidation tally reached $632 to $705 million, roughly 82% of it longs. But spot ETF outflows began three sessions earlier and USDT's market cap has shrunk $6.6 billion in 60 days — the leveraged length left before the inflation print did. A double top at 81,890 and 81,080 leaves a measured target of 69,366.
Author  Suzie
Yesterday 03: 22
Bitcoin fell 2.5% to about $73,400 on 11 November, an 11-week low, breaking its 200-day moving average near $73,100. The 24-hour liquidation tally reached $632 to $705 million, roughly 82% of it longs. But spot ETF outflows began three sessions earlier and USDT's market cap has shrunk $6.6 billion in 60 days — the leveraged length left before the inflation print did. A double top at 81,890 and 81,080 leaves a measured target of 69,366.
goTop
quote