


The Stock Market Is Repeating a Pattern Not Seen in Decades, but History Says Investors Who Make This 1 Move Will Win Out
Key Points
Major market indexes stumbled last week amid a brutal tech stock sell-off.
One prominent valuation metric is repeating a pattern only observed during the dot-com bubble burst.
History says it's simpler than you might think to protect your investments.
- Motley Fool Issues Rare "Total Conviction" Buy Alert ›
The stock market has been in a rough patch lately, with major market indexes stumbling hard last week.
The S&P 500(SNPINDEX:^GSPC), Dow Jones Industrial Average(DJINDICES:^DJI), and Nasdaq Composite (NASDAQINDEX:^IXIC)all fell sharply from their recent all-time highs, with the Nasdaq plunging into correction territory.
Missed Nvidia in 2009? This Rare Signal Is Flashing Again. In 2009, a "Double Down" signal flashed for a little-known chipmaker called Nvidia. For the first time in years, that same "Total Conviction" signal is flashing for a company 1/100th the size of Nvidia. Continue »
Stocks have also been repeating a pattern that's reminiscent of the dot-com bubble burst, which could serve as a warning to investors right now. Fortunately, history says this foolproof strategy can protect your portfolio even if a crash is coming.

Image source: Getty Images.
Will the stock market bubble burst in 2026?
Tech and AI stocks were hit hard last week amid concerns that stricter regulation could limit growth. But some market metrics have been warning about valuations for months, with parallels to the tech boom in the late 1990s.
The S&P 500 Shiller CAPE Ratio is a metric that tracks the market's overall valuation over time. Higher figures suggest the S&P 500 may be overvalued, and it's historically had a strong inverse correlation with stock prices--meaning prices tend to fall after this metric peaks.
Since 1871, this metric has surged dramatically just a handful of times. Its most severe spike occurred in 1999, when it surpassed 40 for the first time in history. It remained elevated throughout the year, and in March 2000, the dot-com bear market officially began.
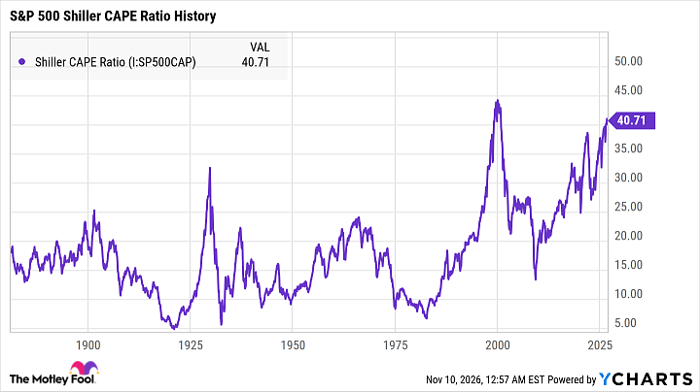
Shiller CAPE Ratio data by YCharts
Now, we're seeing a similar pattern. The CAPE Ratio surpassed 40 for the first time since the dot-com bubble in May 2026, staying above that level for months on end.
To be clear, this doesn't necessarily mean the market is headed toward a dot-com-style meltdown, even though tech stocks have been volatile lately. It does suggest, however, that the market is the most richly valued it's been in decades, and eventually, overvalued stocks tend to correct themselves.
History says this is the best move to make right now
While the market has somewhat rebounded from its downturn last week, as of this writing, there's no way to know whether it will continue rallying or whether this is just a temporary reprieve before another crash.
However, it doesn't necessarily matter what the market does in the coming weeks or months, because history says the most effective strategy is to invest in quality stocks and hold them for the long term.
In the late 1990s, countless tech stocks exploded in value during the dot-com bubble. Many of them, however, were built on shaky foundations. Whether it was a weak competitive advantage, poorly managed finances, an unsustainable business model, or an inexperienced leadership team, these stocks were hit the hardest when the bubble popped -- and some never recovered.
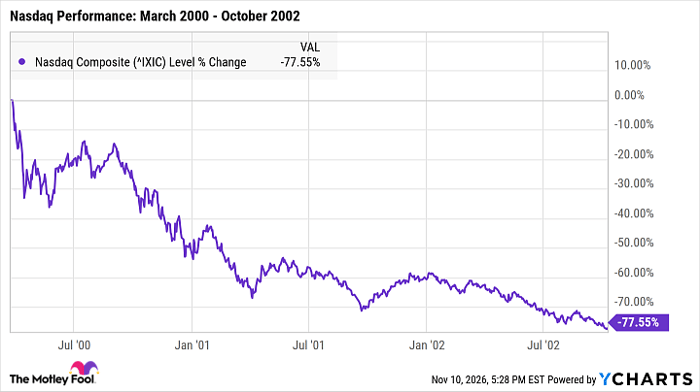
^IXIC data by YCharts
But not all tech stocks failed. Some went on to become industry leaders just a few years after the dot-com bear market, and the broader market has smashed performance records over the last two decades.
In fact, since March 2000, the S&P 500 has earned total returns of more than 700% -- and that's despite facing the Great Recession almost immediately after recovering from the dot-com bear market.
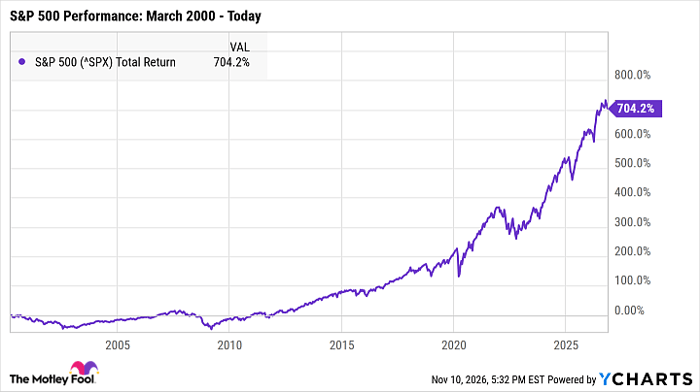
^SPX data by YCharts
As market valuations climb, it's increasingly likely that some stocks may be overvalued. Overvalued stocks often underperform the market over time, and if a stock also has weak fundamentals, it's more likely to struggle during the next bear market or recession.
The best move you can make right now, then, is to double-check that each stock in your portfolio has strong long-term growth potential, and then prepare to hold your investments for at least a few years.
If more volatility is coming, history says this is your best bet for protecting your portfolio.
Should you buy stock in S&P 500 Index right now?
Before you buy stock in S&P 500 Index, consider this:
The Motley Fool Stock Advisor analyst team just identified what they believe are the 10 best stocks for investors to buy now… and S&P 500 Index wasn’t one of them. The 10 stocks that made the cut could produce monster returns in the coming years.
Consider when Netflix made this list on December 17, 2004... if you invested $1,000 at the time of our recommendation, you’d have $344,878!* Or when Nvidia made this list on April 15, 2005... if you invested $1,000 at the time of our recommendation, you’d have $1,097,846!*
Now, it’s worth noting Stock Advisor’s total average return is 852% — a market-crushing outperformance compared to 208% for the S&P 500. Don't miss the latest top 10 list, available with Stock Advisor, and join an investing community built by individual investors for individual investors.
See the 10 stocks »
*Stock Advisor returns as of November 11, 2026.
Katie Brockman has no position in any of the stocks mentioned. The Motley Fool has no position in any of the stocks mentioned. The Motley Fool has a disclosure policy.
Recommended Articles


