


Nebius Falls to Near Seven-Month Low Ahead of Earnings, Down Over 55% From June High as Bearish Trend May Push Stock Toward $110
TradingKey - Nebius (NBIS) is set to report quarterly earnings, but the stock remains under noticeable selling pressure ahead of the release. In the latest trading session, the stock fell 5.27% to $134, touching an intraday low of $130.90 and once again nearing its lowest levels since April of this year. Compared with its peak near $300 in June, NBIS has pulled back more than 55% cumulatively, virtually unwinding the entire rally previously driven by AI data center expansion.
Nebius remains a potential beneficiary of growing demand for AI computing power, but investors are no longer valuing the company purely on revenue growth and order backlog. Instead, they are placing greater emphasis on data center delivery schedules, capital expenditures, financing costs, and cash flow performance. Because building GPU clusters, power infrastructure, and networking systems requires sustained, massive capital commitments, even high revenue growth may not immediately alleviate market concerns over cash burn.
Large cloud computing contracts provide Nebius with high future revenue visibility, but an overreliance on a small number of customers also magnifies risk. If key clients adjust their AI investment budgets, delay data center projects, or tighten partnership terms, the company's revenue recognition and capacity utilization could both be adversely affected.
This earnings report will serve as an important checkpoint for testing the quality of Nebius's growth. If the company can prove that new computing capacity is coming online as planned and deliver future revenue guidance above market expectations, the stock could stage an oversold rebound. Conversely, if project construction is delayed, customer deployment slows, or management further hikes capital expenditure plans, the market may continue to compress its valuation.
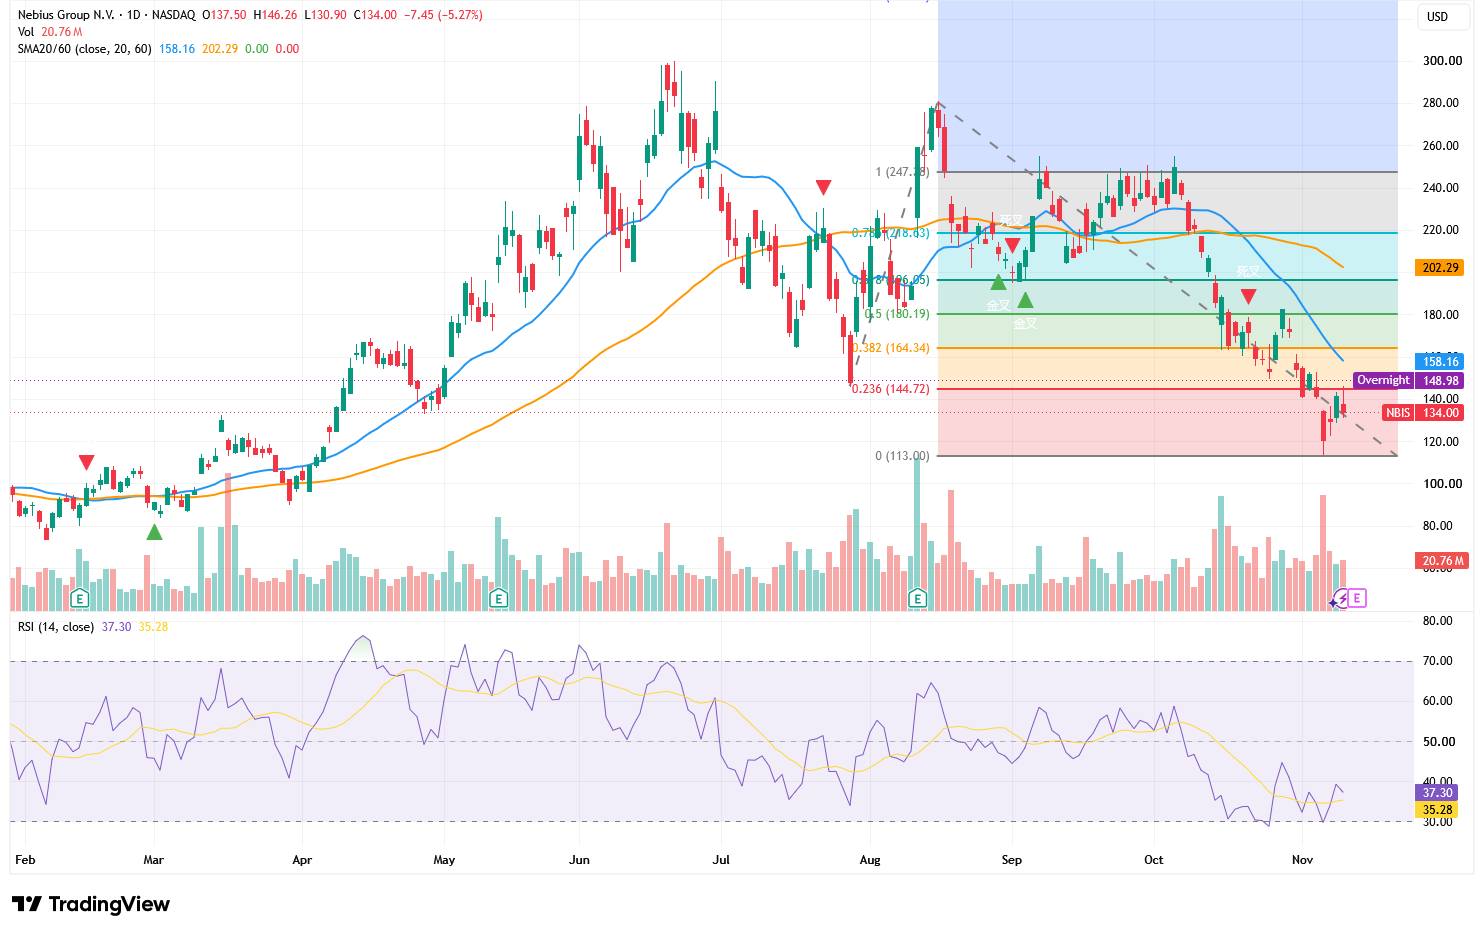
Source: TradingView
From a technical perspective, NBIS has formed a relatively clear bearish moving-average alignment. The stock is currently trading not only below its 20-day moving average of $158.16, but also well below its 60-day moving average of $202.29. Both moving averages slope downward, with the short-term average positioned below the medium-term average, indicating that sellers remain in control of the market. Until the stock reclaims the 20-day moving average, any current gains are better viewed as technical consolidation within a downtrend rather than the start of a new upward rally.
Nebius previously held key support near $145, a level that also sits close to the 23.6% Fibonacci retracement of the recent rally. However, the stock has now broken below this line of defense, turning former support into short-term resistance. Even if earnings spark a rebound, the $145 to $150 area is likely to encounter heavy overhead selling pressure from trapped positions.
If NBIS can reclaim $145 after earnings, the next resistance will sit near $158, corresponding to the steadily declining 20-day moving average. Only a breakout above $158 on heavy volume that holds for several trading sessions could shift the short-term structure from a one-way decline toward range-bound bottoming. Higher up, $164 and $180 correspond to a previous congestion zone and a Fibonacci retracement level, respectively, and are expected to present substantial resistance as well.
To the downside, $130 has become the most immediate line in the sand between bulls and bears ahead of earnings. The intraday low sits just a step away from this level. If earnings or guidance fall short of expectations and drive NBIS to close below $130 on a daily basis, bears may push to test $120. That area served as the launchpad for the early-November rebound, but its strength as support has not yet been fully tested.
If $120 fails to halt the decline, the next downside target will point to the $110 to $113 range. Technical charts show that $113 lies near the starting point of the previous rally and marks a full retracement under Fibonacci calculations, while $110 constitutes a key psychological threshold. A drop from $134 to $110 represents a potential decline of nearly 18%. Once the stock falls into this range, it would mean that virtually all gains since June have been completely erased.
Momentum indicators have yet to flash a clear reversal signal. The 14-day Relative Strength Index stands around 37.3; while it has ticked up from oversold territory near 30 and sits slightly above its smoothed signal line near 35.3, it remains below the 50 neutral mark. This suggests that while short-term selling pressure may have moderated somewhat, overall momentum remains tilted to the downside. Only if the RSI drops below 30 again while the stock tests $110 to $113 might the market stage a more decisive oversold rebound.
Recommended Articles


