


AMD Stock Erases Its 17% Crash in Two Sessions, but Can It Clear $515.13?
TradingKey - Advanced Micro Devices (NASDAQ: AMD) jumped 13.26% to $508.58 on Monday, November 9, adding nearly $100 billion in market value, and overnight trading held near $506.15. The stock is now about 26% above Thursday's close of $404.40 and back above its post-earnings close of $488.78.
The recovery took just two sessions, helped on Monday by an Oppenheimer upgrade and a Google win. Even so, AMD sits about 23% below its 52-week high of $658.52, and the $508 to $515 zone, which used to be support, now stands in the way.
A 17% Crash That Had Little to Do With AMD
On Thursday, November 5, AMD fell 17.26% as the PHLX Semiconductor Index, a benchmark of major chip stocks, dropped 12.25%, its worst day since March 2020. After the midterm elections, some investors worried about tougher AI rules and state pushback on new data centers, while Nomura's Charlie McElligott pointed to hedge funds locking in gains on the year's biggest winners. Micron fell 17.46% and Nvidia 9.26% that day.
Nothing in AMD's own outlook changed between its report and the crash, which helps explain why the selling reversed so quickly. CEO Lisa Su told Yahoo Finance that Thursday afternoon, "I think the market can sometimes be a little bit short-sighted. It is what it is." AMD rebounded about 11% to $449.04 on Friday.
What Drove Monday's Jump
Monday's buying had company-specific support, starting with Oppenheimer's Rick Schafer, who upgraded AMD to Outperform from Perform with a $600 target in a note dated Sunday, November 8. He models data center revenue growth of 135% next year. AMD also said its EPYC server processors will be the host chips, which run the system around Google's own AI chips, in Google Cloud's new TPU 8tx systems. Nor did the rally need help from Nvidia, which fell after its board opened an independent investigation involving CEO Jensen Huang.
Q3 Results Still Back the Growth Story
The upgrade rests on a strong third quarter, when revenue rose 45% to a record $13.4 billion and non-GAAP EPS, which leaves out items such as stock-based pay, rose 74% to $2.09. Data center revenue nearly doubled, up 97% to $8.5 billion, or 64% of the total, while gaming fell 40%. For Q4, AMD guided revenue to about $17 billion, plus or minus 3%, up about 66% from a year earlier.
Looking further out, Su said AMD expects revenue to grow "more than 80% in 2027," with data center above 80% of sales, though she called the segment figures markers rather than formal guidance. Anthropic, Meta, Microsoft, OpenAI and Oracle are the lead customers for Helios, AMD's full-rack AI system.
The Weak Spot Is Cash Flow
For now, that growth is costing cash. Free cash flow, the cash left after capital spending, fell to $554 million in Q3, about 4% of revenue, from $1.56 billion in Q2. Inventory jumped by about $3 billion to $11.46 billion as AMD built stock for data center demand, and CFO Jean Hu said AMD will "continue to invest in inventory and capacity to support our strong growth in 2027." AMD also guided Q4 gross margin, the share of revenue left after production costs, to about 55%, slightly below Q3's 56%.
In my view, the demand story is intact, but AMD is spending heavily ahead of 2027, so the next move higher needs Helios shipments to turn that inventory into sales.
AMD Technical Analysis: Daily Close Above $515.13 Could Open $577.91
On the daily chart, the rebound took AMD from last week's low near $401.93 back into the $508 to $515 zone in two sessions. That zone acted as support for months before it broke. Former support often turns into resistance, because traders who bought there may sell to break even, so this is the key test. The broken rising trendline from August, a line drawn under its higher lows, also sits just above, near $540.
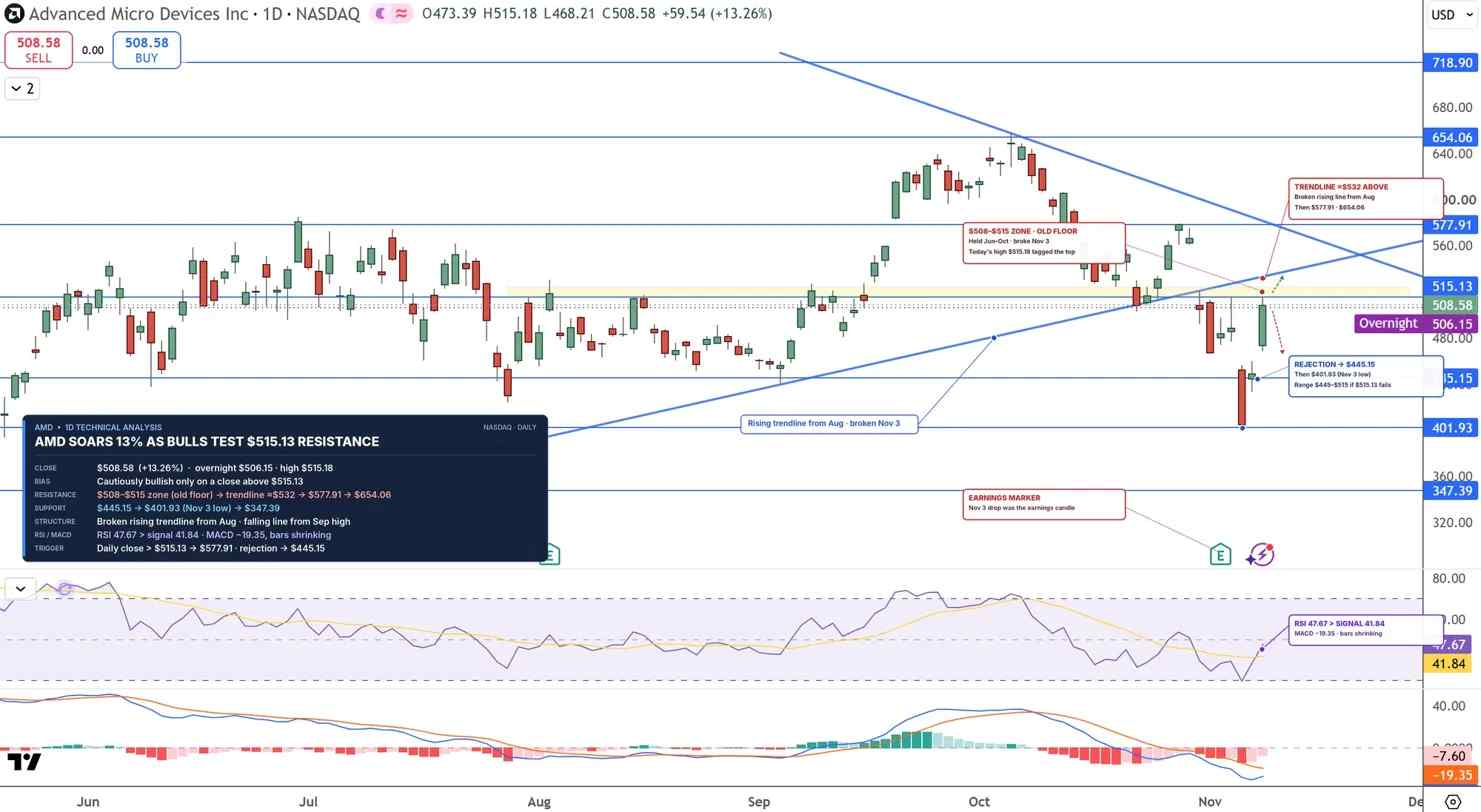
AMD Stock Price Chart - Source: Tradingview
RSI, a momentum gauge that runs from 0 to 100, has jumped to about 48, just below the neutral 50 line. The MACD, a trend-following momentum indicator, is still negative, but its bars are shrinking, so selling pressure is fading.
A daily close above $515.13 could open the way for $577.91, then $654.06, just below the 52-week high. A rejection here could send AMD back toward $445.15, and a break below that would put last week's $401.93 low back in play.
I'm cautiously bullish if AMD closes above $515.13. Failure there would likely keep the stock in a range between $445.15 and $515.13.
Key Levels
- Last close: $508.58, up 13.26% on Monday, November 9 (overnight: $506.15)
- Support: $488.78, $445.15, $401.93
- Resistance: $515.13, $577.91, $654.06
- RSI: 47.67, just below the 50 midline
- Bullish trigger: Daily close above $515.13
- Bearish trigger: Daily close below $445.15
FAQs
Why did AMD stock jump on Monday?
AMD rose 13.26% on Monday after Oppenheimer upgraded it to Outperform and AMD said its EPYC processors will power Google Cloud's new TPU 8tx systems, erasing the rest of last week's chip selloff.
What is the AMD stock forecast now?
The bias is cautiously bullish if AMD closes above $515.13 on the daily chart, which could open $577.91 and $654.06. A rejection could send it back toward $445.15 and keep the stock in a range.
Bottom Line
AMD's growth outlook did not change during last week's crash, and the fast rebound shows buyers still back its data center story. Everything now depends on $515.13, the top of the old support zone. I expect a push toward $577.91 if AMD closes above it, while another rejection would likely keep it stuck between $445.15 and $515.13.
Recommended Articles


