


CME vs. SoFi Technologies: Which Financial Stock Is a Better Buy for 2027?
Key Points
CME Group dominates the global derivatives market with an exceptionally high net margin and consistent cash flow.
SoFi Technologies is rapidly expanding its member base and diversifying into high-growth financial technology infrastructure.
Which of these financial plays is the better choice for your 2027 investment horizon?
- Motley Fool Issues Rare "Total Conviction" Buy Alert ›
Investors often choose between established industry giants and disruptive newcomers. CME Group (NASDAQ:CME) and SoFi Technologies (NASDAQ:SOFI) represent two very different paths within the financial landscape for those looking ahead to 2027.
CME operates massive exchanges for futures and options, thriving on market volatility and institutional volume. SoFi is a digital-first bank aiming to be a one-stop shop for young, high-earning consumers. This comparison examines their business models, growth trajectories, and financial health to help you decide which one fits your goals.
The case for CME
CME Group operates the world's most prominent derivatives marketplace, handling contracts for interest rates, equities, and commodities. Its clients include global financial institutions, central banks, and professional traders. The company also maintains a joint venture with Flutter Entertainment (NYSE:FLUT) to explore prediction markets.
In fiscal 2025, revenue reached nearly $6.5 billion, representing growth of roughly 6.4% over the prior year. This consistent expansion translated into net income of about $4 billion. The company maintained a high net margin of approximately 62% during this period.
As of CME's December 2025 balance sheet, the debt-to-equity ratio was nearly 0.1. This ratio measures total debt relative to shareholder equity. The current ratio, which compares short-term assets to short-term liabilities, was approximately 1. In fiscal 2025, CME generated approximately $4.2 billion in free cash flow. Free cash flow is the cash a company generates after subtracting capital expenditures from its operating cash flow.
The case for SoFi Technologies
SoFi Technologies serves members through an integrated app that provides banking, lending, and investment services. Through its Galileo and Technisys platforms, the company provides infrastructure to other banks and fintech stocks. This segment creates a diversified revenue stream beyond consumer lending. It also works with Mastercard (NYSE:MA) to facilitate modern payment solutions for its members.
In fiscal 2025, revenue reached nearly $4.8 billion, representing growth of roughly 28.8% from the previous year. The business generated net income of nearly $481.3 million. This resulted in a net margin of approximately 10.1%.
As of SoFi's December 2025 balance sheet, the debt-to-equity ratio was roughly 0.2. The current ratio was approximately 0.2. In fiscal 2025, the company reported negative free cash flow of close to $4 billion.
Risk profile comparison
CME Group faces competition from other major exchanges like Intercontinental Exchange (NYSE:ICE), Cboe Global Markets (NYSEMKT:CBOE), and Nasdaq (NASDAQ:NDAQ). Its business is highly sensitive to global trading volumes, which can fluctuate based on geopolitical stability or economic shifts. Additionally, the company must manage significant cybersecurity risks and the potential for infrastructure failures, as seen in a 2025 data center incident.
SoFi Technologies is highly dependent on macroeconomic conditions and interest rate movements, which affect loan demand. As a bank holding company, it navigates complex regulatory environments that could impact its lending capacity. SoFi also faces credit and fraud risks in its digital asset offerings and potential reputational damage from legal challenges regarding talent acquisition.
Valuation comparison
SoFi Technologies carries a significantly lower price-to-sales multiple, while CME Group offers a lower forward earnings multiple despite its much higher net margin.
| Metric | CME Group | SoFi Technologies |
|---|---|---|
| Forward P/E | 24.5 | 27.8 |
| P/S ratio | 15.6 | 3.5 |
Valuation metrics include sourcing from Financial Modeling Prep (FMP) and may differ from other data providers.
The forward P/E relates the stock price to future earnings estimates for the coming year. The P/S ratio compares the market value of the company to its sales over the past 12 months.
Which stock would I buy for 2027?
SoFi Technologies is posting significantly higher revenue growth, but the company is also earlier in its life cycle, so I would expect (at least, I would hope) that it would be doing so. However, CME Group's high net margin absolutely dwarfs SoFi's. CME also pays a modest dividend, and SoFi does not.
Over the past five years, CME Group shares have outperformed SoFi stock, although neither has matched the S&P 500's return.
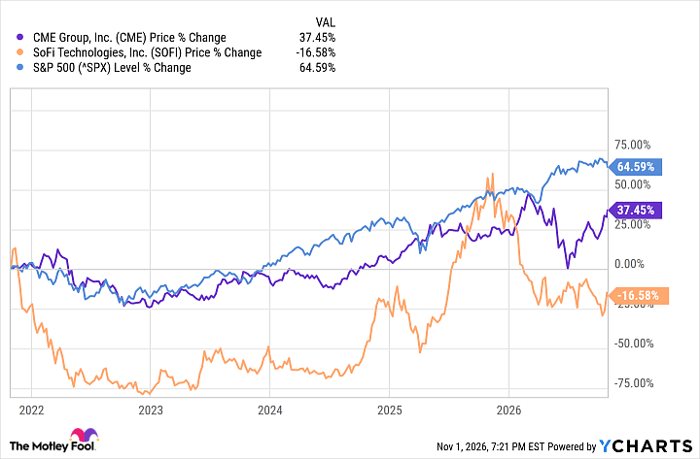
CME data by YCharts
Past performance is no guarantee of future results, but for investors, those results are disappointing. The point of buying individual stocks is to outperform the market. Why take the risk of a single stock when you could buy a large basket of some of the biggest companies in the U.S.?
Regardless, between CME and SoFi, I would be more inclined to invest in the former. The derivatives specialist's high net margin is attractive, and I like companies that reward shareholders with dividends.
Should you buy stock in CME Group right now?
Before you buy stock in CME Group, consider this:
The Motley Fool Stock Advisor analyst team just identified what they believe are the 10 best stocks for investors to buy now… and CME Group wasn’t one of them. The 10 stocks that made the cut could produce monster returns in the coming years.
Consider when Netflix made this list on December 17, 2004... if you invested $1,000 at the time of our recommendation, you’d have $334,793!* Or when Nvidia made this list on April 15, 2005... if you invested $1,000 at the time of our recommendation, you’d have $1,257,420!*
Now, it’s worth noting Stock Advisor’s total average return is 874% — a market-crushing outperformance compared to 209% for the S&P 500. Don't miss the latest top 10 list, available with Stock Advisor, and join an investing community built by individual investors for individual investors.
See the 10 stocks »
*Stock Advisor returns as of November 2, 2026.
Erin Kennedy has positions in CME Group and Mastercard. The Motley Fool has positions in and recommends CME Group and Mastercard. The Motley Fool recommends Cboe Global Markets, Flutter Entertainment Plc, Intercontinental Exchange, and Nasdaq. The Motley Fool has a disclosure policy.
Recommended Articles


