


The Stock Market Has Done This Just Twice in 156 Years. Now It's Happening Again.
Key Points
The stock market has reached a historically high valuation, driven in large part by enthusiasm around AI.
History doesn't guarantee another crash, but investors should ensure their portfolios are prepared for a potential downturn.
- Motley Fool Issues Rare "Total Conviction" Buy Alert ›
For four years now, the stock market has been on a massive bull run. Since bottoming out in October 2022, the S&P 500 (SNPINDEX: ^GSPC) has soared, fueled in no small part by enormous gains in stocks connected to artificial intelligence (AI). But with stock valuations approaching very extreme levels, investors have good reason to pause and ask: How much longer can this rally last?
It turns out history has something to say about that.
Missed AI’s "Act 1"? Act 2 Could Be 15x Bigger. Most investors think they missed the AI boat because they didn't buy Nvidia in 2005. But according to our analysts, we’re only at the end of "Act 1"—the R&D phase. "Act 2" is the global rollout. Continue »

Image source: Getty Images.
What history tells us about today's stock market
Throughout the history of the stock market, periods of unusually high stock valuations have been followed by significant market downturns. To see why that matters today, just consider how expensive stocks have become by one of Wall Street's most widely followed valuation metrics: the cyclically adjusted price-to-earnings (CAPE) ratio.
The CAPE ratio compares the S&P 500's current price with its average inflation-adjusted earnings over the past 10 years. Put simply, it shows us how expensive the stock market is relative to what companies have earned over the last decade.
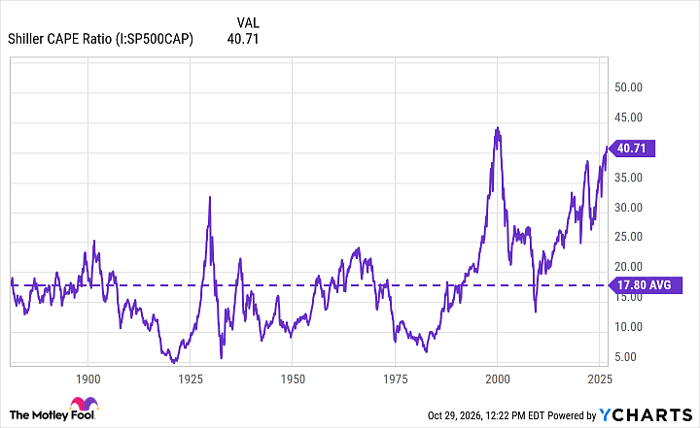
Data by YCharts.
Looking at the chart above, we can see that the CAPE is hovering at 40.71, one of the highest readings in 156 years. The last time the CAPE ratio was this high was the dot-com bubble, when the stock market was in the midst of an extraordinary bull run. Of course, a market downturn followed that rally, leading to one of the worst downturns in recent history.
Notably, the dot-com rally wasn't the first time investors paid such high prices for stocks, only to watch the market collapse later. Something similar happened in 1929, when the CAPE reached what was then a record high, shortly before the stock market famously crashed.
Nearly a century after the Great Depression, valuations have spiked in a similar fashion for the third time. That doesn't, of course, mean a crash is inevitable. But it would be unwise, I think, to ignore what happened the last two times, especially with obvious parallels between this bull market and its predecessor in the late 90s.
There are, of course, very important differences between today's AI-driven bull market and the internet boom of the 90s. Unlike many of the speculative internet companies that dominated in the late 1990s, today's AI boom is driven by enormously profitable companies, like Nvidia (NASDAQ: NVDA), Microsoft (NASDAQ: MSFT), and Alphabet (NASDAQ: GOOG) (NASDAQ: GOOGL). That gives today's bull market a much more solid foundation than the fuzzy promises of future profits that fueled the dot-com bubble.
The dot-com boom, then, isn't an exact synonym for today's AI rally. But if there's one lesson we can take from it, it's that even a promising technological revolution doesn't guarantee a bull market will last forever. The internet did, after all, revolutionize the world (just consider the screen in front of you). That didn't spare investors from incurring enormous losses when the dot-com bubble burst.
Right now, the stock market could be approaching a similar reckoning. That's not a reason to sell everything, but it is a good reason to look over your portfolio and ensure it is prepared for a potential downturn. Today's bull market might be different, but that doesn't mean it's immune to the same risks that brought previous rallies to an end.
Missed AI’s "Act 1"? Act 2 Could Be 14x Bigger
Most investors think they missed the AI boat because they didn't buy Nvidia in 2005.
But according to our analysts, we’re only at the end of "Act 1"—the R&D phase. "Act 2" is the global rollout, a massive technology build-out that Google’s CEO says could be more profound than fire or electricity.
While everyone watches the chip designers, one "backbone" company provides the critical technology that Nvidia and AMD literally cannot function without. We’ve detailed this under-the-radar player in our new AI Playbook.
Continue »
Steven Porrello has positions in Nvidia. The Motley Fool has positions in and recommends Alphabet, Microsoft, and Nvidia. The Motley Fool has a disclosure policy.
Recommended Articles


