


SoFi Stock Forecast: Q3 Earnings Spark 13% Rally as SOFI Faces $16.75 Resistance
TradingKey - SoFi Technologies (NASDAQ: SOFI) has given investors a reason to revisit the stock after a difficult year. Shares jumped 13.42% to $16.40 on October 27, following stronger third-quarter earnings and an ambitious 2027 outlook. The rebound is encouraging, but the next question is whether improving fundamentals can help SOFI sustain a technical recovery above $16.75.
Why Did SOFI Stock Jump After Q3 Earnings?
SoFi reported third-quarter GAAP net revenue of $1.385 billion, up 44% year over year, while adjusted net revenue reached $1.371 billion. GAAP net income rose 73% to $241 million, with diluted earnings of $0.18 per share. Adjusted EBITDA increased 70% to approximately $470 million, representing a 34% margin.
The stock's response was decisive. Trading volume exceeded 160 million shares on October 27, more than three times its recent daily average. That level of activity suggests the earnings release prompted a major reassessment, although it cannot tell us how much buying came from long-term investors rather than short covering.
Can Record Member Growth Support SoFi's Expansion?
SoFi added a record 1.2 million members during the quarter, taking its membership base to 17.1 million, up 35% from a year earlier. Total products climbed 44% to 26.7 million. Importantly, 51% of new products were opened by existing members.
This cross-selling trend matters because acquiring a customer once and offering several useful services can improve the economics of each relationship. SoFi's Financial Services segment generated $525.1 million in quarterly revenue, up 25%, while its Invest products increased 37% to more than four million. The challenge is to translate product growth into consistently stronger profits after marketing and servicing costs.
What Do Loan Originations and Deposits Reveal?
Total loan originations rose 71% to a record $16.9 billion. Personal loans accounted for approximately $12.6 billion, student loans $2.9 billion, and home loans $1.4 billion. Crucially, the headline includes loans originated on behalf of third parties through SoFi's Loan Platform Business, so it should not be interpreted entirely as new loans retained on SoFi's balance sheet.
Deposits increased $5.8 billion during the quarter to $51.3 billion. SoFi estimates its deposit-funded model delivers approximately $745 million in annualized interest-expense savings compared with warehouse financing. Net interest margin improved 16 basis points sequentially to 6.14%.
I see the deposit base as an important part of the investment case. Lower-cost funding supports lending margins, though its benefit will still depend on loan demand, credit quality and interest-rate conditions.
Why Is SoFi's 2027 Guidance So Important?
Management raised its 2026 adjusted net revenue guidance to $5.04 billion, alongside $1.66 billion in adjusted EBITDA and $0.61 in adjusted EPS.
For 2027, SoFi introduced targets of $6.4 billion in adjusted net revenue, $2.24 billion in adjusted EBITDA, and $0.90 in adjusted EPS. That implies roughly 27% revenue growth and 48% adjusted EPS growth compared with its 2026 guidance.
The difference points to expected operating leverage, meaning profits could grow faster than revenue as the business scales. However, these are management projections, not achieved results, and SoFi has not reconciled its forward non-GAAP targets to GAAP figures.
Is SoFi Becoming Less Dependent on Lending Income?
Fee-based revenue reached $570.6 million, or about 42% of quarterly revenue. Sources include loan origination fees, interchange, brokerage and technology services. More fee income may diversify the business, but some of those fees still depend on healthy lending activity.
SoFi is also testing digital-dollar products. On October 22, it announced SoFi Earn (SOFIE), a tokenized bank deposit offering a variable 4.40% APY at launch, subject to terms and eligibility. SOFIE deposits are distinct from cryptocurrencies or payment stablecoins and are eligible for FDIC coverage within applicable limits. The offering creates a potential engagement opportunity, but its earnings contribution is not yet established.
Is SOFI Stock Undervalued After the Rally?
At $16.40, SOFI trades at approximately 18.2 times management's projected 2027 adjusted EPS of $0.90. That is a useful forward valuation reference, not a GAAP P/E multiple or a guarantee that the target will be achieved.
The valuation becomes more compelling if SoFi delivers its expected earnings acceleration. Yet the risks remain meaningful. Personal lending exposes the company to unemployment and consumer credit deterioration. Its annualized personal-loan charge-off rate improved to 2.26% from 2.60% a year earlier, but that measure is also affected by loan sales and origination mix.
Another area to monitor is Technology Platform revenue, which fell 24% year over year to $87.4 million, partly reflecting a large client exit. SoFi said revenue rose 18% excluding that effect, but a durable recovery in this business is still worth watching.
SOFI Technical Analysis: Can the Breakout Hold Above $16.17?
Based on the supplied four-hour chart interpretation, SOFI has pushed above the resistance line of its descending channel and reclaimed two plotted moving averages following a rebound from the lower part of the pattern. The October 27 close at $16.40 provides a stronger near-term backdrop, although the breakout remains vulnerable to a reversal.
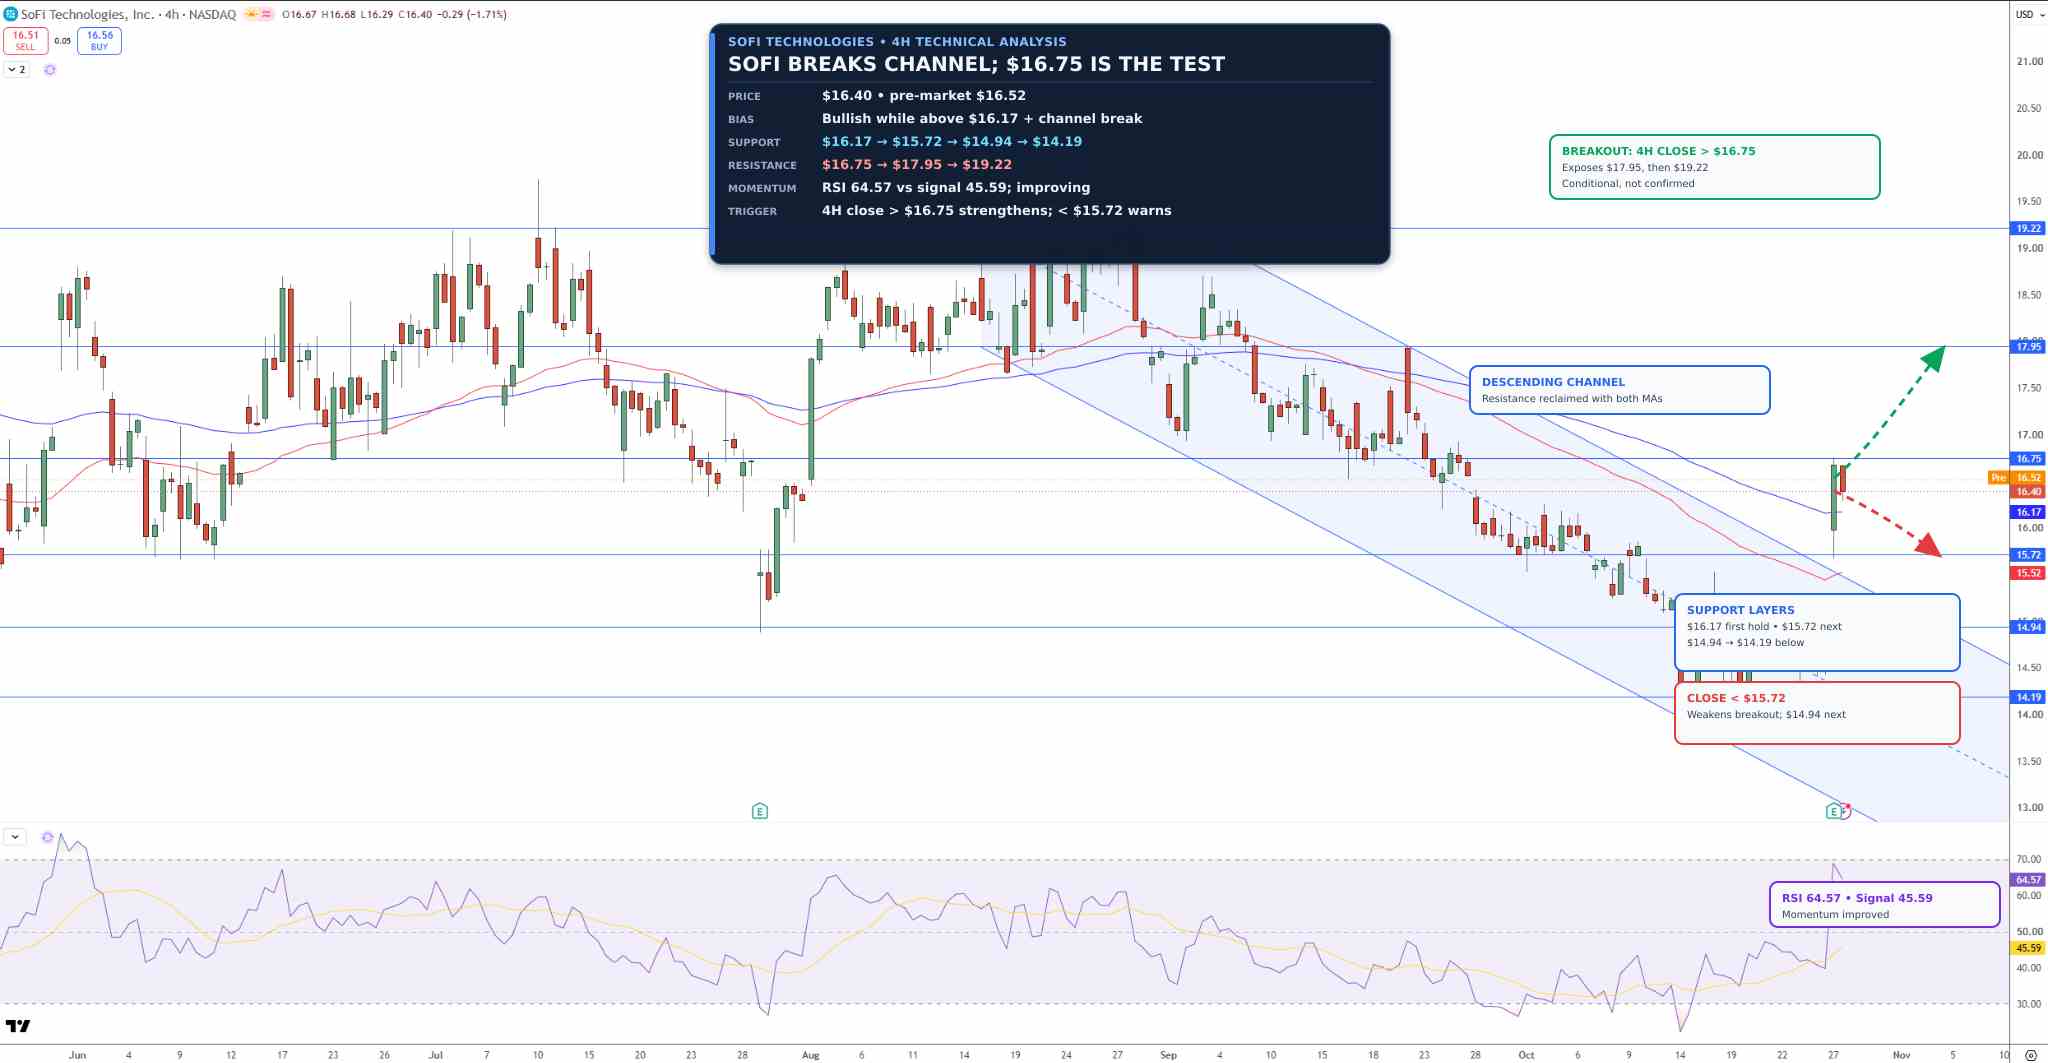
SoFi Stock Price Chart - Source: Tradingview
The first upside hurdle is $16.75, which price briefly exceeded intraday on October 27 before closing below it. A sustained four-hour close above that area would improve the case for $17.95, followed by $19.22. On the downside, $16.17 is the first support to watch, then $15.72 and $14.94. A deeper decline could bring $14.19 back into focus.
The supplied chart reading puts the RSI near 65, above its signal line around 46, consistent with stronger bullish momentum but not proof of further gains. My short-term bias remains cautiously bullish above $16.17, while a sustained move below $15.72 would weaken the breakout thesis.
SOFI Stock Forecast: Key Levels to Watch
- $16.75: Immediate resistance and breakout confirmation level on a sustained four-hour close.
- $17.95: First upside target if buying momentum continues.
- $19.22: Higher bullish target if the recovery extends.
- $16.17: Immediate support and the first test of the breakout structure.
- $15.72: Key downside threshold; a sustained break would weaken the bullish setup.
- $14.94 / $14.19: Secondary and deeper support zones if selling pressure returns.
Frequently Asked Questions
Why is SoFi stock rising?
SOFI rallied after its October 27 earnings release showed 44% year-over-year adjusted revenue growth, record member additions and an optimistic 2027 outlook. Investors are now evaluating whether the stronger business performance justifies a lasting recovery in the share price.
What is the SOFI stock price forecast for 2026?
The near-term technical outlook is cautiously bullish while $16.17 holds. A sustained break above $16.75 would put $17.95 in focus, with $19.22 as a higher target. A drop below $15.72 would challenge that scenario. These are chart scenarios, not guaranteed year-end price targets.
Bottom Line
SoFi's latest quarter strengthens the fundamental bullish case through record customer growth, improving funding economics and management's ambitious 2027 profit outlook. The weaker Technology Platform result and exposure to consumer credit still deserve attention.
I would watch $16.75 for upside confirmation and $16.17 for the first sign that buyers are losing control. Beyond the chart, the decisive test will be whether SoFi can deliver its projected margins without allowing credit losses to erode profitability.
Recommended Articles


