

IBM Stock Price Forecast: Pulls Back to $240 Ahead of Earnings, Could Drop Another 16%

Source Tradingkey

TradingKey - As IBM earnings approach, rising risk aversion puts pressure on the stock price, sending it down toward $240 with the risk of further sliding to the $200 level.

On October 21 Eastern Time, century-old tech giant IBM (IBM) fell slightly in pre-market trading, dipping back near $240 again. Does this mean the bottom-fishing rebound rally has ended?

Since peaking in June this year, IBM's stock price has steadily declined from its all-time high of $330 to a low near $200 at the end of July, resulting in a maximum drawdown of nearly 40%. Since then, IBM's stock has staged a rebound, but has consistently failed to break above $250.

The recent lack of momentum in IBM's stock price rebound is primarily due to the macroeconomic environment weighing on its business. Impacted by macro inflation and prolonged high interest rates, global enterprise clients have turned cautious regarding spending on non-core IT consulting and digital transformation projects. Market participants worry that Q3 consulting revenue growth could slow to single digits or even remain flat year-over-year, squeezing overall gross margin.

Although bookings for the IBM Watsonx AI platform continue to grow, whether Red Hat infrastructure revenue can sustain double-digit rapid growth remains to be tested. If AI tools fail to translate significantly into high-margin incremental subscriptions, quantitative funds may defensively de-rate its high valuation.

After the market closes today, IBM will report its third-quarter (Q3) 2026 financial results. If the reported figures fail to alleviate the market's aforementioned concerns or if guidance falls severely short of expectations, the stock price could drop another 16%, testing the $200 level directly. However, IBM possesses high free cash flow and solid dividend distribution capabilities, making a breakdown below $200 less likely; it is more of a chip shakeout stemming from a high valuation.
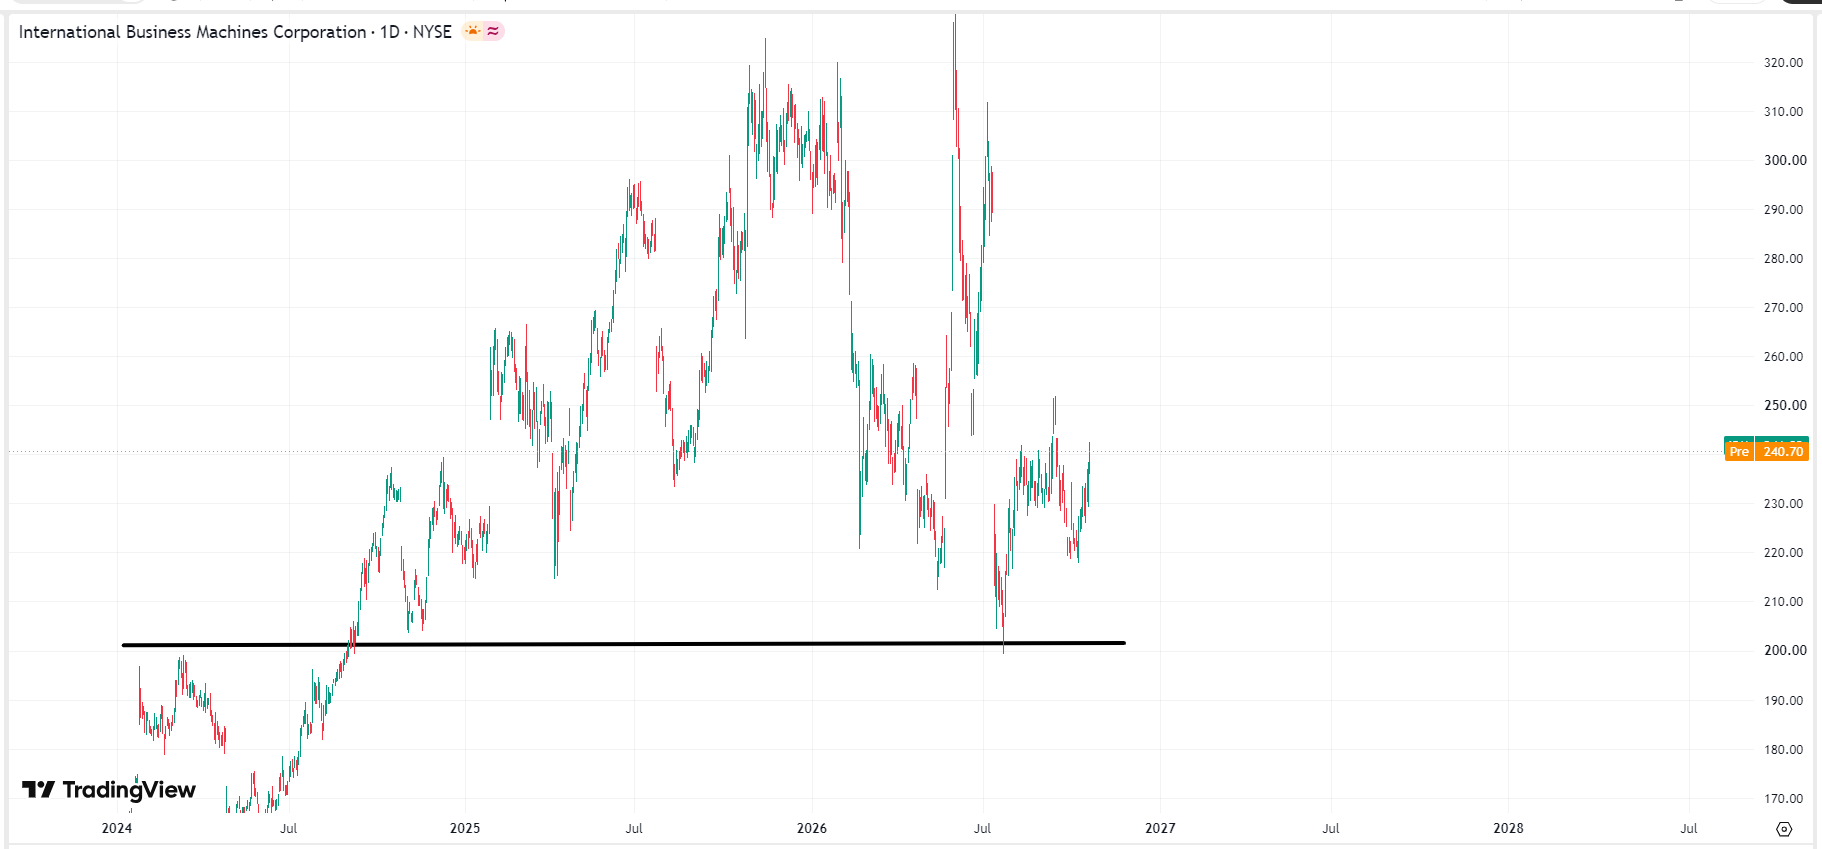
ibm-price-91a0cba823984c4face4ece0bad6c916IBM stock price chart, Source: TradingView

If earnings per share (EPS) and free cash flow beat expectations, and management delivers strong full-year FCF guidance, the stock price will extend its rebound. However, the upside potential of IBM's rebound remains limited, facing a resistance zone of $248–$252, which represents the highest point of the recovery since the plunge in July this year. A direct breakthrough in the short term is unlikely unless macroeconomic policy shifts toward easing.

Disclaimer: For information purposes only. Past performance is not indicative of future results.
placeholder
Today’s Market Recap: U.S. Stocks Rebound as Nasdaq Gains 1.11%, Memory Chip Stocks Rally, SanDisk Jumps 5.5%U.S. stocks rebounded on Monday, October 19, following a sharp sell-off in AI infrastructure stocks last week, lifting the Nasdaq Composite and S&P 500.At the clo
Author  TradingKey
Yesterday 01: 25
U.S. stocks rebounded on Monday, October 19, following a sharp sell-off in AI infrastructure stocks last week, lifting the Nasdaq Composite and S&P 500.At the clo
placeholder
Gold Price Analysis Today | Forex Gold Analysis | XAU/USD Analysis - October 20, 2026Get the latest gold price analysis, forex gold insights, and XAU/USD analysis for October 20, 2026. Read on for the details.
Author  Mitrade
Yesterday 03: 17
Get the latest gold price analysis, forex gold insights, and XAU/USD analysis for October 20, 2026. Read on for the details.
placeholder
Dollar presses 102 as the 10-year yield sits at 5.14% — and October hike odds are only 17%The dollar index closed at 101.99 (+0.20%) on Monday after briefly topping 102.07, while the 10-year Treasury yield rose to 5.14% and the 2-year hit 4.774% — yet futures price only about a 17% chance of a hike at the October 27-28 FOMC, versus roughly 90% for December. The driver is a global bond selloff, not a Fed repricing: France's 10-year OAT jumped to 4.84% ~ 4.94% and the OAT-Bund spread widened to 140 ~ 146bp. Here are the levels, the cross-asset read-through and what to watch.
Author  Irene Q.
Yesterday 05: 50
The dollar index closed at 101.99 (+0.20%) on Monday after briefly topping 102.07, while the 10-year Treasury yield rose to 5.14% and the 2-year hit 4.774% — yet futures price only about a 17% chance of a hike at the October 27-28 FOMC, versus roughly 90% for December. The driver is a global bond selloff, not a Fed repricing: France's 10-year OAT jumped to 4.84% ~ 4.94% and the OAT-Bund spread widened to 140 ~ 146bp. Here are the levels, the cross-asset read-through and what to watch.
placeholder
Tesla Q3 Earnings Preview: Can Auto Margins Stabilize? Wall Street’s Highest Price Target at $550Tesla (TSLA) will report its third-quarter 2026 financial results after the U.S. stock market close on October 21, Eastern Time, and host an earnings conference call at 17:30 that day. Th
Author  TradingKey
Yesterday 10: 22
Tesla (TSLA) will report its third-quarter 2026 financial results after the U.S. stock market close on October 21, Eastern Time, and host an earnings conference call at 17:30 that day. Th
placeholder
Gold Price Analysis Today | Forex Gold Analysis | XAU/USD Analysis - October 21, 2026Get the latest gold price analysis, forex gold insights, and XAU/USD analysis for October 21, 2026. Read on for the details.
Author  Mitrade
12 hours ago
Get the latest gold price analysis, forex gold insights, and XAU/USD analysis for October 21, 2026. Read on for the details.
goTop
quote