


Netflix Stock Forecast: Ad Cut and Soft Q4 Guide Push NFLX Toward $65.52 Support
TradingKey - Today, on Wednesday, October 21, the stock price of Netflix (NFLX) is likely to open sharply lower following it’s Q3 report. On Tuesday, the NFLX price closed at $68.69, dropping around 1.66%, then it further fell about 6% in extended trading to around $65. For the moment, the premarket quotes hold at $64.84. The stocks were already down around 25% this year and about 48% below the June 2025 record high.
Overall, the quarter itself was fine, but the outlook wasn’t as the Q4 revenue and EPS (earnings per share) guidance came in below estimates. Moreover, Netflix cut its 2026 advertising revenue forecast to about $2.7 billion from approximately $3 billion. That puts the stock right on the $65.52 demand zone, and today's close will decide whether it holds.
Q3 Beat on Profit, Matched on Revenue
Q3 revenue was $12.87 billion, a 12% increase and in line with estimates. EPS was $0.87, versus $0.82 expectations and $0.59 a year ago. Operating income rose 37% to about $4.5 billion. The operating margin was 34.6% which beat the 33.2% margin guide. However, Netflix said that the margin difference was due to expense timing, and it won't impact Q4. Churn improved from last year, and was better than the estimate.
Q4 Guidance Fell Short of Estimates
Netflix projected Q4 revenue at $13.44 billion, short of the $13.51 billion estimate, and projected EPS at $0.67, short of $0.73 estimate. The company expects 26% operating margin, with about 1.2 percentage points of margin attributable to restructuring.
The restructuring, which involved cutting approximately 1,000 jobs or about 6% of staff, is expected to cost about 1.2 percentage points of Q4 operating margin. Full year revenue is expected at $51.1 billion, 13% growth, while margin is expected at 31.5%.
Revenue growth for Q4 is expected to be in the range of 12%. Q2 revenue growth was about 13%. Bloomberg Intelligence expects the outlook to represent "a slowing growth algorithm" and reflects expectations of slower growth in subscriptions.
Advertising Falls Behind Plan
While advertising was expected to make up for slowed subscription growth, it appears that the ad offering is still incomplete. Netflix cites a slower-than-expected rollout of some ad product capabilities, while subscription revenue outperformed. The ad tier will launch in 15 new countries in 2027, starting with 12 markets in March.
Unless a strong case for a renewed focus on advertising is given during the January 2027 update, I expect this to be viewed negatively by the market.
Engagement and Leadership Changes
Netflix said it wants to accelerate view-hour growth, and said member response to the 2026 price increases was consistent with prior price changes. Increases in view hours in India resulted in record paid net adds.
There has been positive engagement at the top as well. Peter Rice, the former Disney and Fox executive, replaces Bela Bajaria. Also, Dan Lin, the head of film, announced his departure.
Most recently, the streaming service announced a new licensing deal with Disney for Disney-produced series and films.
A Record Buyback Didn't Stop the Selling
In Q3, Netflix bought back a record 63.9 million shares for a total of $4.8 billion, its largest buyback ever, and still has $22.3 billion of buyback authorization left. In Q3, free cash flow jumped to $2.9 billion. It lowered its 2026 free cash flow forecast to about $12.0 billion from $12.5 billion, primarily due to a real estate deal that is expected to close in Q4.
A profit beat and record buyback didn't stop the selling. That shows how much investors are disregarding margins and capital returns, and pricing Netflix on growth.
Netflix Technical Analysis: Daily Close Below $65.52 Could Open $58.68
Netfixl (NFLX) closed at $68.69 yesterday. Currently, it is priced around $64.84 before the open. The demand zone between $65.52 and $68.69 was tested several times in the previous month and in early October. Should it open and close below the demand zone today, it could continue lower. In the bigger picture, the trend remains bearish. The declining trendline, initially drawn from the high of $108 from April, is currently acting as resistance and is currently around $73. The price is currently well below the 200 day simple moving average (SMA) at $82.78 and the 50 day SMA at $73.24. Both are in a downtrend.
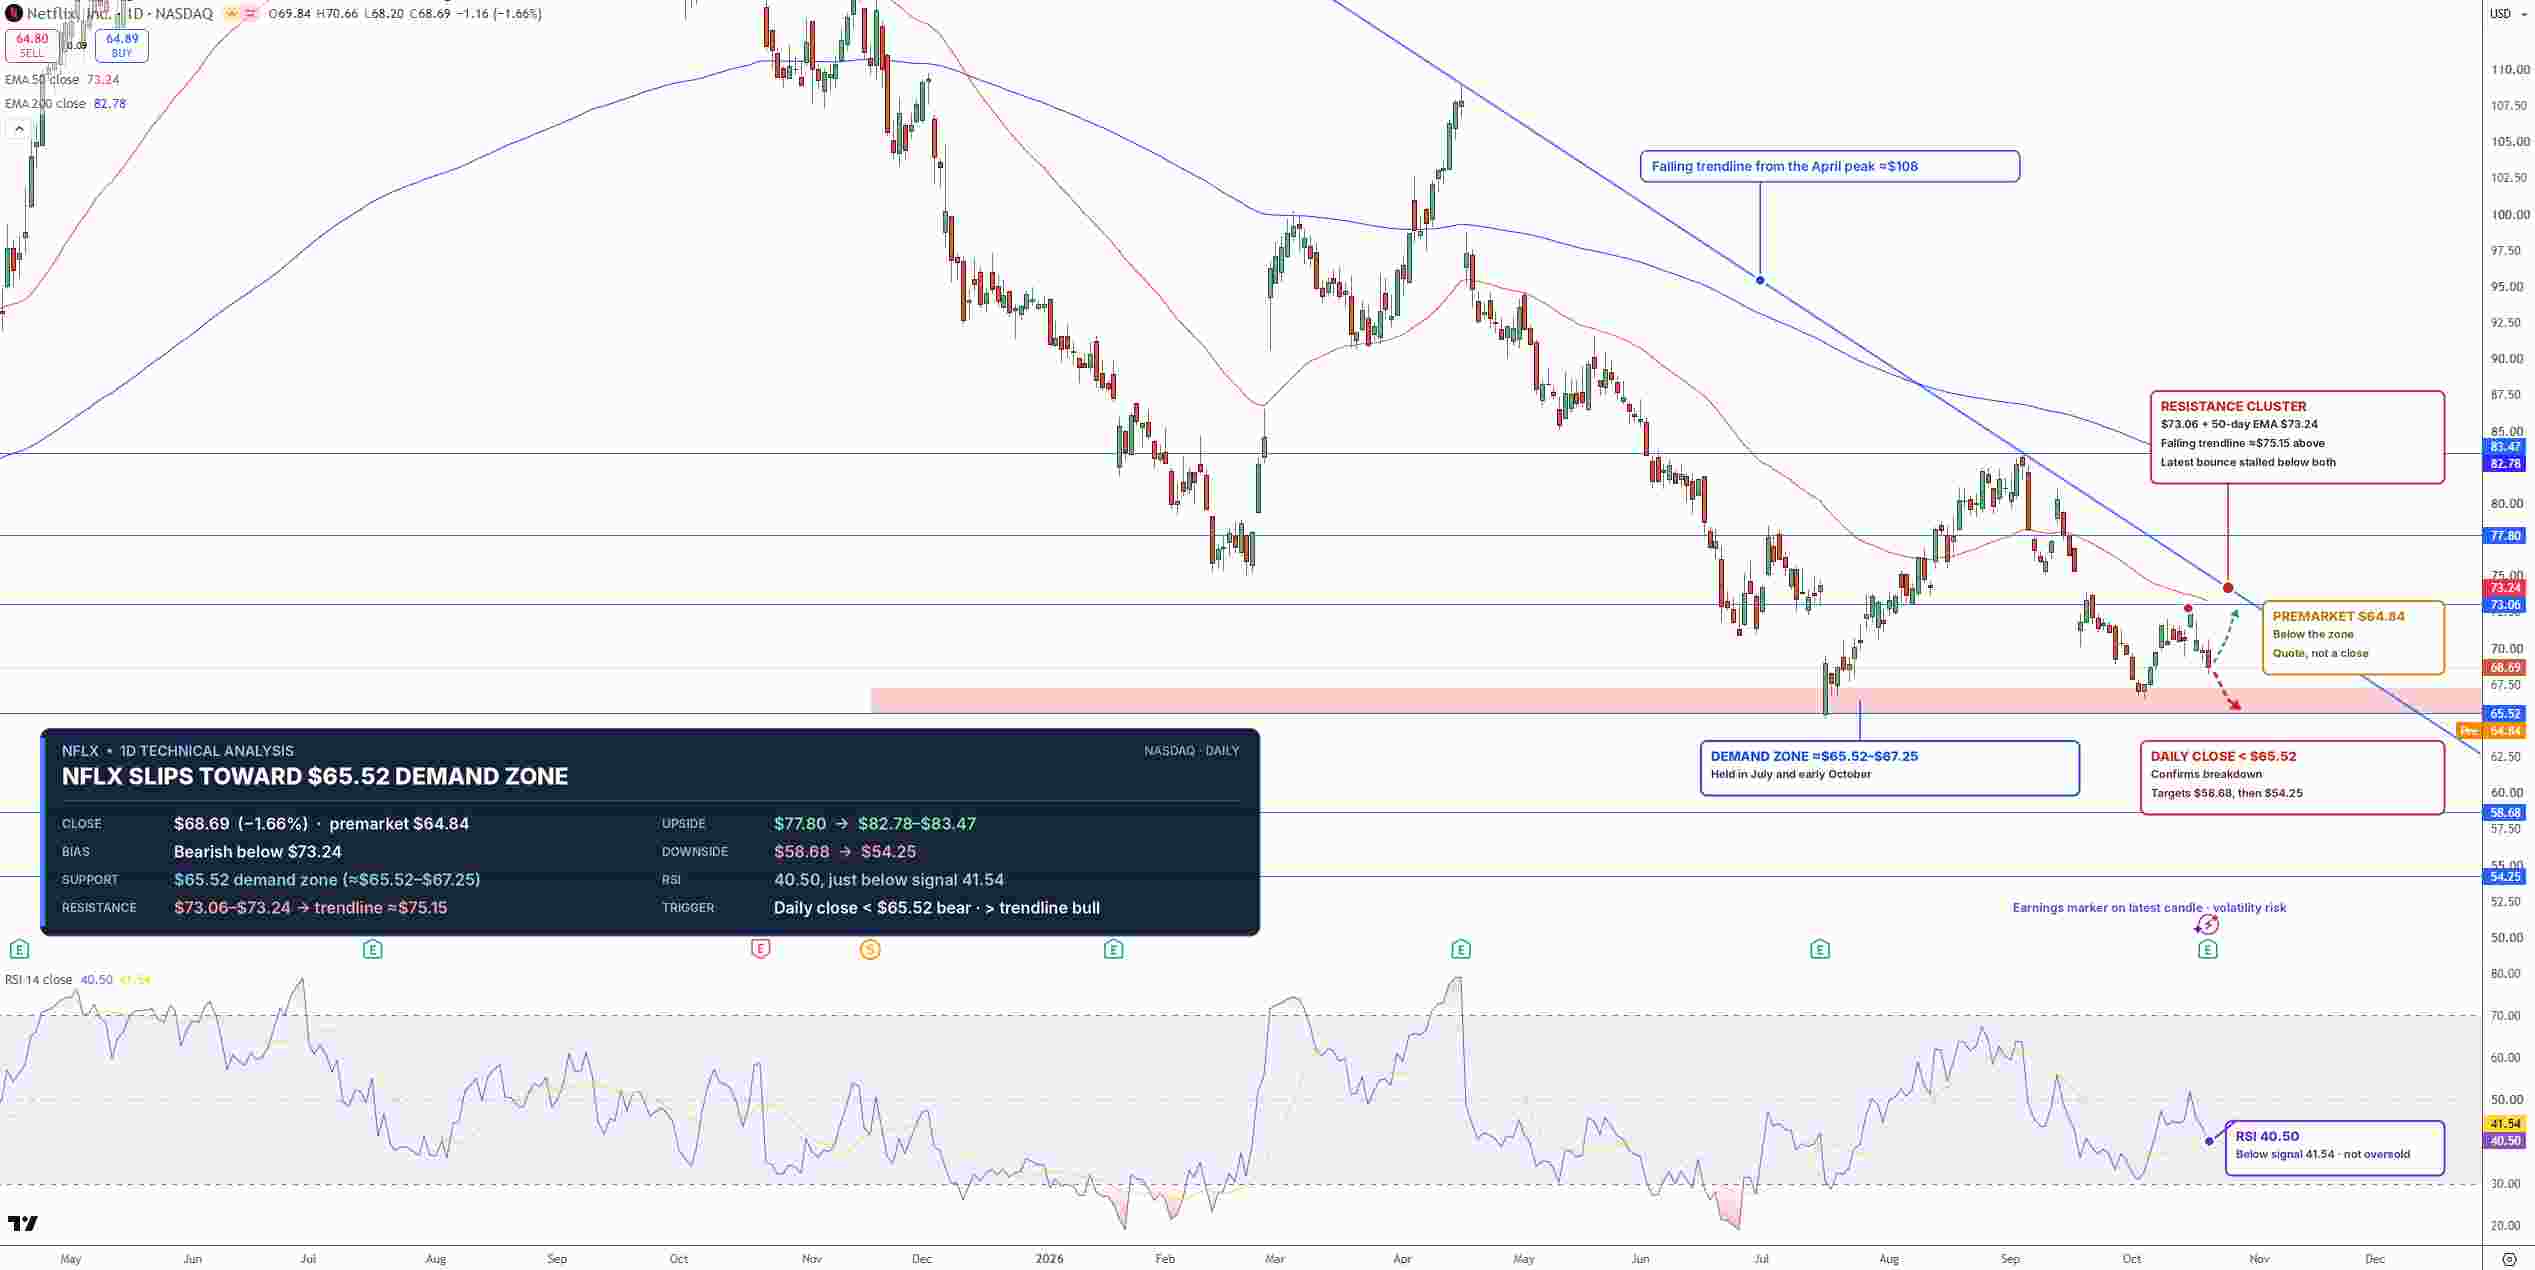
Netflix Stock Price Chart - Source: Tradingview
Relative Strength Index (RSI) is at 40.5. The oversold signa; is not present yet, and could continue lower before a bigger move is made.
Looking at the larger picture, the trend remains bearish. Should NFLX close below $65.52, it could test $58.68. Later support could be found at the $54.25 area. The $73.24 resistance could be tested if the zone is defended by the bulls. The next resistance could be found at the $77.80 area.
I am bearish Netflix as long it remains below the $73.24 resistance area.
Key Levels
Last close: $68.69, down 1.66% on October 20
Support: $65.52, $58.68, $54.25
Resistance: $73.06 to $73.24, $77.80, $82.78 to $83.47
RSI: 40.50, below its 41.54 signal line
Bullish trigger: Daily close above $73.24
Bearish trigger: Daily close below $65.52
FAQs
Why did Netflix’s stock price decrease after releasing its Q3 results?
Although Netflix reported EPS that exceeded expectations, the company issued lower than expected Q4 EPS and revenue guidance and reduced its 2026 ad revenue forecast from about $3 billion to $2.7 billion. As a result, the stock fell by approximately 6% in after-hours trading.
What is expected of Netflix stock after the earnings release?
Although the stock closed the day at $68.69, the after-hours drop below $65.52 was bearish. If the stock closes below $65.52, look for additional weakness and possible support at approximately $58.68 and $54.25. A move above $73.24 would see resistance at approximately $77.80.
Bottom Line
Beating EPS estimates was not enough to satisfy the street, and the Q4 guidance failed to represent upside potential. Given the current price action, look for additional weakness and support at approximately $58.68. A move above $73.24 would negate this view.
Recommended Articles


