


If I Could Only Buy 1 Artificial Intelligence (AI) Stock Before the Market Crashes, It Would Be This One
Key Points
The S&P 500 is trading close to its most expensive level as measured by the Shiller CAPE ratio.
When the Shiller CAPE ratio reaches levels around 40, the stock market historically crashes.
Even if a crash is on the way, Alphabet stock looks like an attractive investment in the long-run.
- Motley Fool Issues Rare "Total Conviction" Buy Alert ›
Artificial intelligence (AI) has been one of the biggest drivers of the stock market's rally over the last few years. While this enthusiasm has propelled the S&P 500 to record highs, there's a growing concern that investors may be getting ahead of themselves.
The S&P 500 Shiller CAPE ratio, which measures stock valuations against 10 years of inflation-adjusted earnings, is hovering above 41. Readings this elevated are extremely rare, raising questions about whether the market is due for a correction. After several years of exceptional returns, investors should think about what stocks they want to own if sentiment suddenly changes.
Missed Nvidia in 2009? This Rare Signal Is Flashing Again. In 2009, a "Double Down" signal flashed for a little-known chipmaker called Nvidia. For the first time in years, that same "Total Conviction" signal is flashing for a company 1/100th the size of Nvidia. Continue »
During downturns, I prefer companies with established competitive advantages, diversified revenue streams, and enough financial flexibility to keep investing while weaker competitors fall behind. This is why Alphabet (NASDAQ: GOOGL) (NASDAQ: GOOG) is near the top of my shopping list.

Image source: Getty Images.
Alphabet's business is built to withstand uncertainty
One of Alphabet's biggest strengths is that so many of its products are embedded in everyday life. Think about how frequently people use Google Search, Gmail, YouTube, Google Maps, Android, and Chrome. Although the use of these services isn't a discretionary purchase in the traditional sense, they are integrated into how billions of people around the world communicate, navigate, work, and discover information.
The advantage of this model is that Alphabet can attract users through its ecosystem of free services and monetize people's activity through advertising. Since its products are interconnected, Alphabet can easily introduce new features and services to existing customers rather than constantly creating new products and marketing to different demographics.
Alphabet's reach extends far beyond consumers. Through Google Cloud, Alphabet provides computing infrastructure, cybersecurity, data analytics, and AI services to enterprise customers. This diversified business model comes in handy during economic downturns. Advertising budgets often decline when businesses become cautious, but enterprise technology budgets usually follow different priorities.
The most compelling thing about Alphabet is the company's ability to vertically integrate its various businesses. Within Google Cloud, the company offers its own custom silicon, called Tensor Processing Units (TPUs). It also operates data centers, builds AI models through Google DeepMind, and distributes AI-powered products through Search, Gemini, and Workspace.
How has Alphabet stock held up during market crashes?
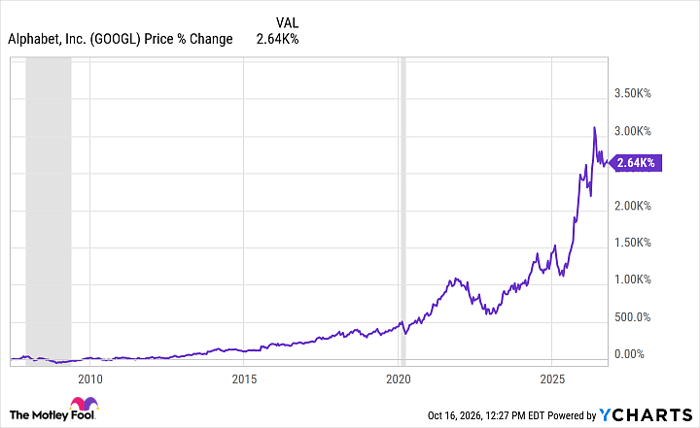
During the 2008 financial crisis, Alphabet shares declined 55% for the year. The recession pressured advertising spending, and investors abandoned growth stocks. The stock also experienced a peak-to-trough drawdown of roughly 31% during the COVID-19 crash in early 2020. Most recently, Alphabet lost roughly 39% of its value during the 2022 bear market as rising interest rates and economic uncertainty dragged on the technology sector.
While those are substantial losses, here's what makes Alphabet interesting. Despite experiencing multiple severe downturns, the company continued growing its businesses, launching new products, and quietly strengthening its competitive position. The gray-shaded columns in the chart below mark recessions. The theme here is that investors who bought Alphabet stock during market downturns and held on to their positions benefited materially from the company's subsequent recoveries.
GOOGL data by YCharts
Alphabet's biggest advantage is its balance sheet
During the second quarter, Alphabet generated $119.8 billion in revenue, representing 24% growth year over year. Its Google Services segment generated $94.5 billion in revenue while Google Cloud grew an impressive 82% to $24.8 billion. This shows how Alphabet is able to benefit from both an established advertising franchise and the AI economy.
The real story is that Alphabet generated $39.1 billion in operating cash flow during the second quarter, giving the company substantial financial resources to fund research, infrastructure, and other investments. The company ended June with $242.5 billion in cash and marketable securities.
Alphabet's financial flexibility gives the company the ability to invest in AI infrastructure, develop new products, pursue acquisitions, and maintain shareholder distributions (i.e., dividends) without depending entirely on outside financing.
Against this backdrop, Alphabet stock could still fall substantially if the market crashes. Nevertheless, history suggests the company's diversified ecosystem, vertical integration, and extraordinary financial horsepower put Alphabet in a good position to endure a downturn and emerge even stronger. Rather than attempting to time the next stock market crash, I'd consider buying Alphabet stock gradually over time during dips and holding it for the long term.
Should you buy stock in Alphabet right now?
Before you buy stock in Alphabet, consider this:
The Motley Fool Stock Advisor analyst team just identified what they believe are the 10 best stocks for investors to buy now… and Alphabet wasn’t one of them. The 10 stocks that made the cut could produce monster returns in the coming years.
Consider when Netflix made this list on December 17, 2004... if you invested $1,000 at the time of our recommendation, you’d have $380,363!* Or when Nvidia made this list on April 15, 2005... if you invested $1,000 at the time of our recommendation, you’d have $1,315,732!*
Now, it’s worth noting Stock Advisor’s total average return is 919% — a market-crushing outperformance compared to 211% for the S&P 500. Don't miss the latest top 10 list, available with Stock Advisor, and join an investing community built by individual investors for individual investors.
See the 10 stocks »
*Stock Advisor returns as of October 19, 2026.
Adam Spatacco has positions in Alphabet. The Motley Fool has positions in and recommends Alphabet. The Motley Fool has a disclosure policy.
Recommended Articles


