


Netflix Stock Forecast: 1,000 Job Cuts and Slower Growth Set Up a Make-or-Break Q3 Report
TradingKey - Shares of Netflix (NASDAQ: NFLX) added 2.89% to end the day at $72.61 on Thursday, October 15th, after the company announced its largest layoffs in years. The stock remains near the bottom of its 52 week range of $65.08 - $124.86 and is about 42% from its 52 week high.
My prediction is that Netflix is moving from a growth at all costs strategy to focus more on cost discipline and advertising. The main question is if advertising will help close the gap left from slowing subscriber growth and soft user engagement? The question will be answered when they announce their 3rd quarter results after the market close on October 20th.
Netflix Cuts About 1,000 Jobs
On October 14th, Greg Peters and Ted Sarandos, co-CEO's of Netflix, notified employees of approximately 1,000 layoffs which make up about 6% of the company's workforce. The hardest hit areas will be product, tech, legal and HR. At the end of 2025, Netflix had about 16,000 full time employees.
Management has said the cuts will improve margins, but the company has not disclosed how much restructuring charges will be or how much they expect to save. On October 20th, they will have the opportunity to disclose that information for the first time.
The Growth Slowdown Is the Core Issue
Netflix expects Q3 revenues to rise approximately 11.7% to $12.86 billion, with an operating margin of 33.2% and operating income of $4.268 billion. In Q2, revenues increased 13% year over year.
The stock already priced in the miss. In July, the stock declined as much as 9% after Netflix revealed its Q3 guidance, which was below the $13 billion analysts modeled. The current consensus targets a figure near $0.82 EPS on revenues of $12.87 billion, in-line with Netflix's guidance.
Engagement Is the Weak Spot
Although I find gross profit margin to be important, engagement is more compelling. Overall viewing time in the first half of 2026 increased by approximately 2% to approximately 97 billion hours. In addition, beginning in 2027, Netflix will only produce its “What We Watched” report once a year. Because of this, investors will have even less data to measure consumer viewing trends.
What is concerning is that during the conference call, management indicated that engagement and pricing are correlated. In addition, with the news of YouTube’s advertising revenue sharing pilot program, which is offering brands the ability to sponsor specific YouTube videos, I will listen for comments management may make regarding churn and competition from YouTube.
Advertising Is the Main Growth Lever
In line with our expectations, Netflix noted it would achieve around $3 billion in advertising revenue in 2026. This represents approximately double the 2025 figure and sits within full-year revenue guidance of $51.0 billion to $51.4 billion.
The most important question for us is whether advertising can return total growth to the mid-teens. Advertising at around $3 billion would require subscription growth to flatten to achieve total revenue growth.
Warner Bros. Is Off the Table, and Netflix Got Paid
The strategic environment is more clear-cut. In February, Netflix walked away from its deal with Warner Bros. rather than match a higher offer from Paramount Skydance, collecting a $2.8 billion break-up fee in the process. On October 6, Paramount completed its acquisition of Warner Bros. Discovery.
Walking away eliminated the risk of heavy debt and an antitrust lawsuit, however, it created a larger competitor for content and talent.
Analysts Are Lowering Expectations
KeyBanc lowered its price target to $85 from $92 on October 13, maintaining its Overweight rating. Options pricing suggests an 8.6% move in either direction post-earnings. The stock trades at roughly 21x forward estimates, implying the slowdown is largely baked into the valuation.
Netflix Technical Analysis: NFLX Climbs From $66.98 Support as Buyers Target $75.23 Trendline
On my 4-hour chart, NFLX is currently trading at $72.61, flat -0.12%, and has premarket quotes near $70.64. The overarching trend is still bearish, as a descending trendline from the April highs caps every rally. However, the current recovery from the $66.98 demand zone is building some bullish momentum. The demand zone has been tested and defended in July and early October. Additionally, NFLX has broken above the red moving average, currently at $71.83, but is still trading below the blue moving average, which is currently at $73.71.
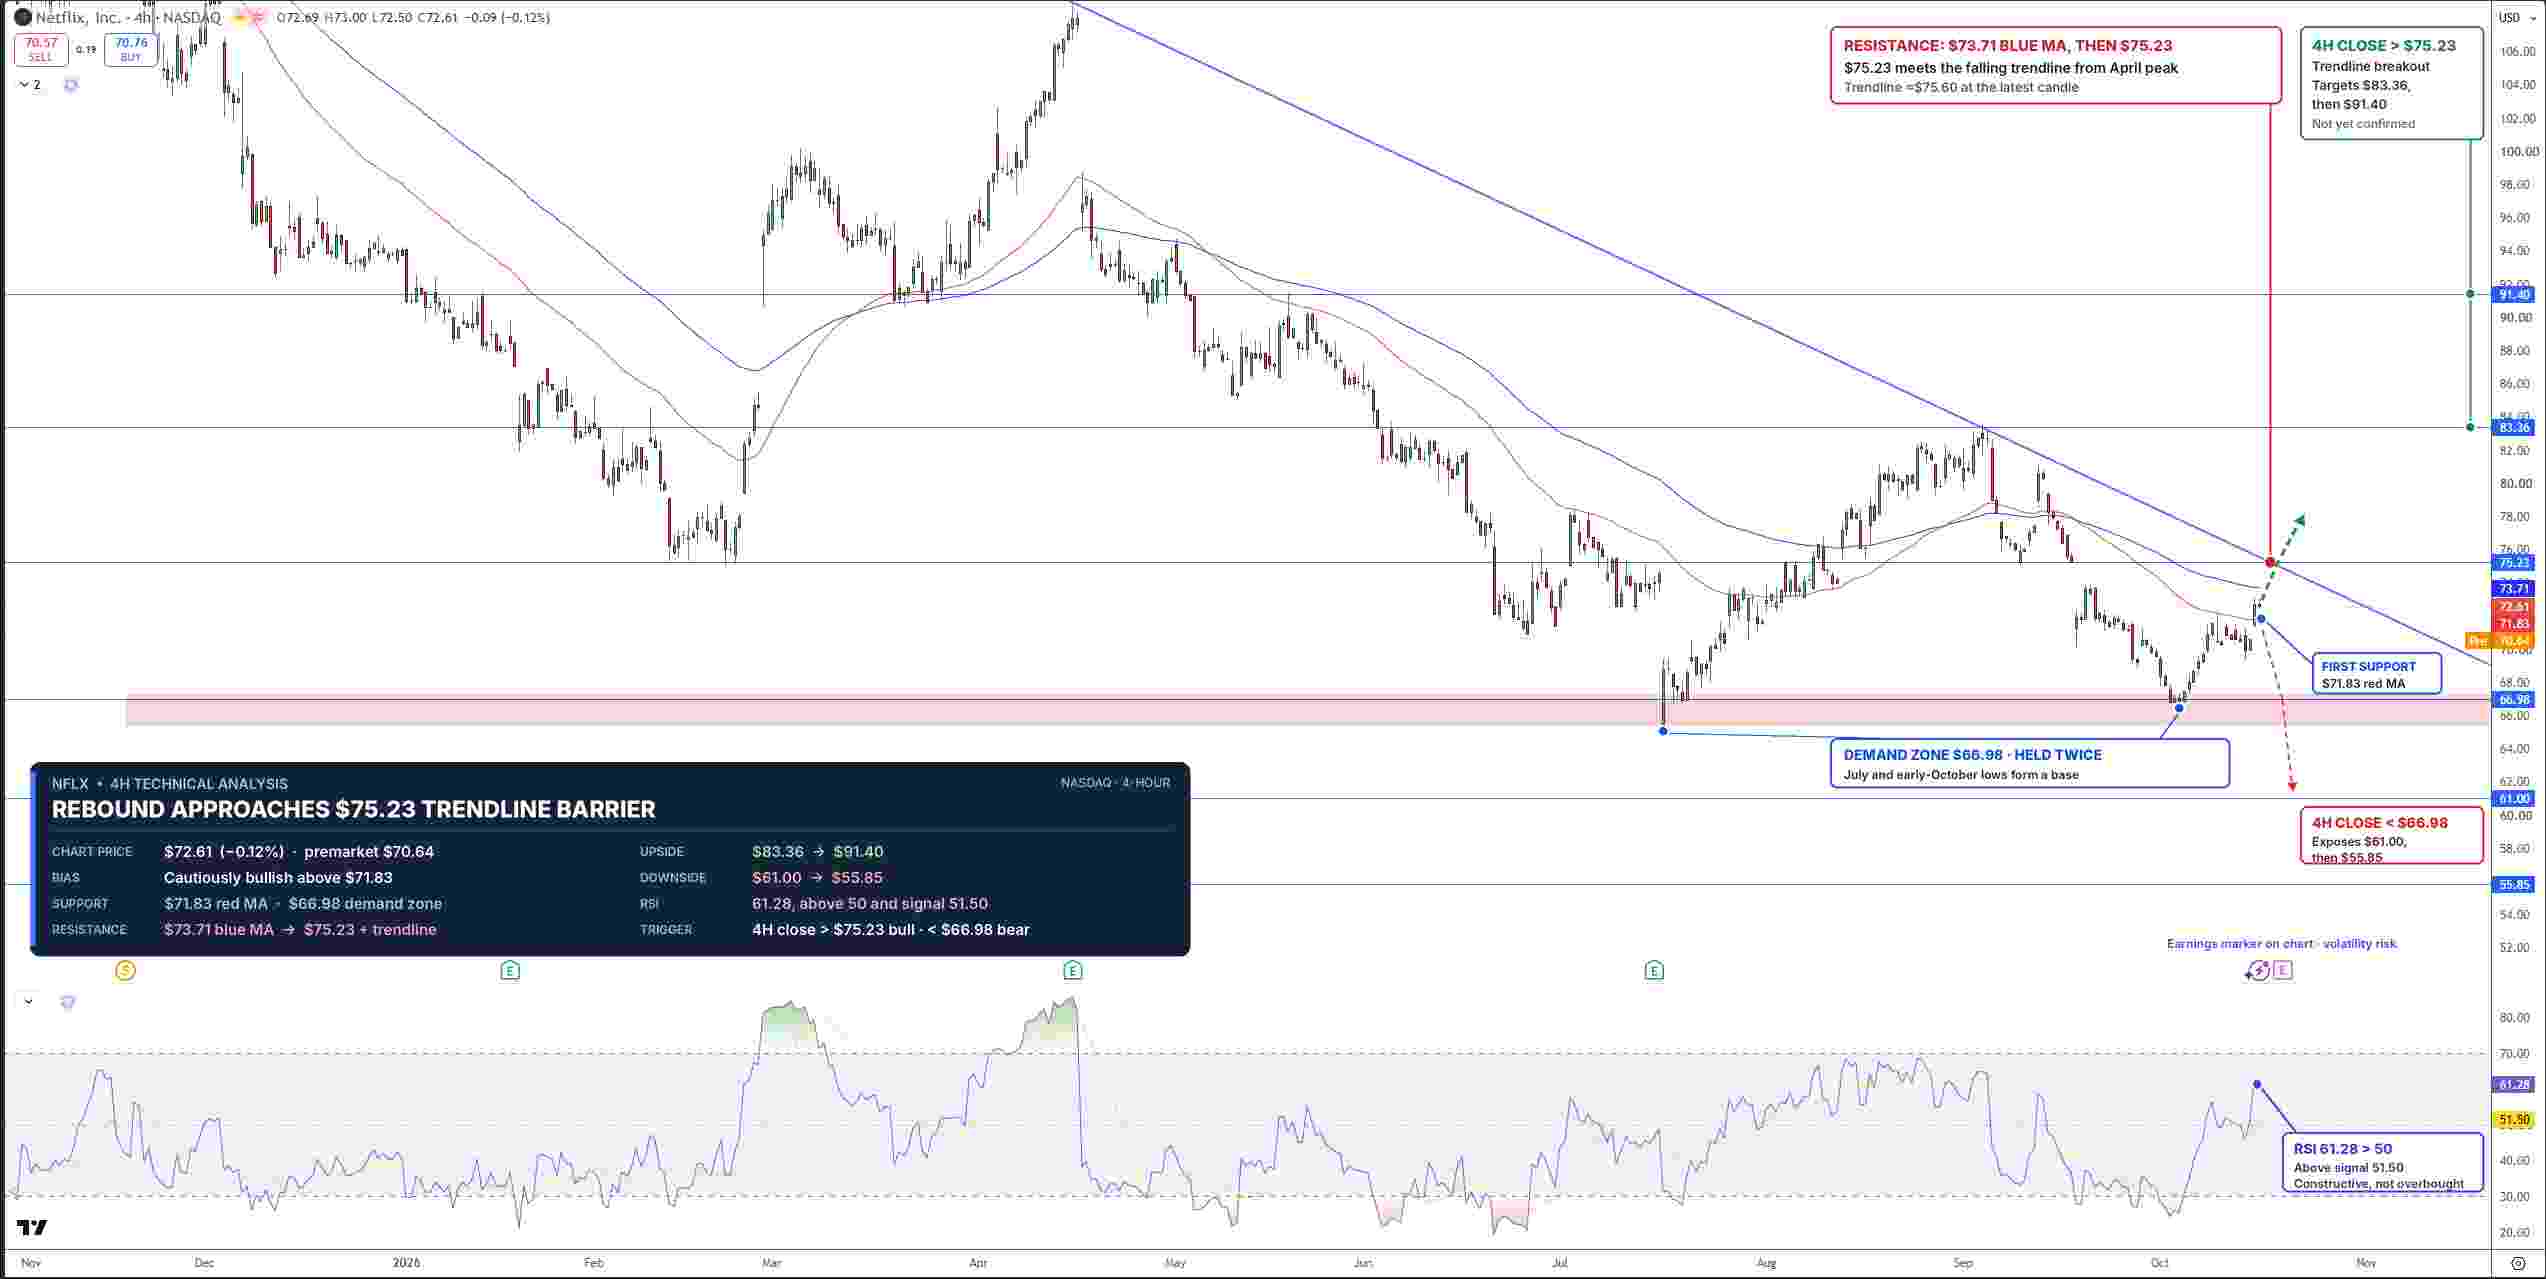
Netflix Stock Price Chart - Source: Tradingview
The RSI has also risen to 61.28 from oversold conditions, and is also above its 51.50 signal line.
Some near-term resistance is at the $73.71 moving average, with more significant resistance at $75.23 and the bearish trendline. A break and close above $75.23 would bring next resistance at $83.36, and ultimately $91.40. More near-term support is at $71.83, with more significant support at $66.98 and then $61.00. Further, a close below $66.98 would bring support at $55.85. Earnings released on Tuesday are expected to bring more volatility. I'm short term bullish as long as NFLX trades above $71.83.
Key Levels
- Last close: $72.61, up 2.89% on October 15
- Support: $71.83, $66.98, $61.00, $55.85
- Resistance: $73.71, $75.23, $83.36, $91.40
- RSI: 61, above its 51.50 signal line
- Bullish trigger: 4-hour close above $75.23
- Bearish trigger: 4-hour close below $66.98
FAQs
Why is Netflix cutting jobs before Q3 earnings?
Netflix will eliminate about 6% of its workforce, focusing on product and technology roles, legal and HR, as the company is expected to grow about 12% and the company leans harder on cost discipline and advertising.
What is the Netflix stock forecast ahead of earnings?
The short-term bias is bullish above $71.83. A close above $75.23 targets $83.36, while a close below $66.98 opens $61.00.
Bottom Line
Management has already slimmed costs and focused the business on advertising. Therefore, the onus is on management to demonstrate why investors should not be concerned with slowing growth and soft user engagement. My view will be positive with a break above $75.23 and negative if a close is made below $66.98.
Recommended Articles


