


Micron Stock Price Forecast: Briefly Dips Below $900 Amid Rate Hike Pressure, Is a Return to Record Highs Far Out of Reach?
Micron Stock Price Fails to Hit All-Time High
TradingKey - In the second quarter of 2026, sold-out HBM3e capacity and surging AI server demand drove Micron (MU)'s stock price to continuously soar, reaching an all-time high of $1,255 at the end of June. In July, Micron's stock price experienced a sharp shakeout, pulling back deeply to $737 at one point.
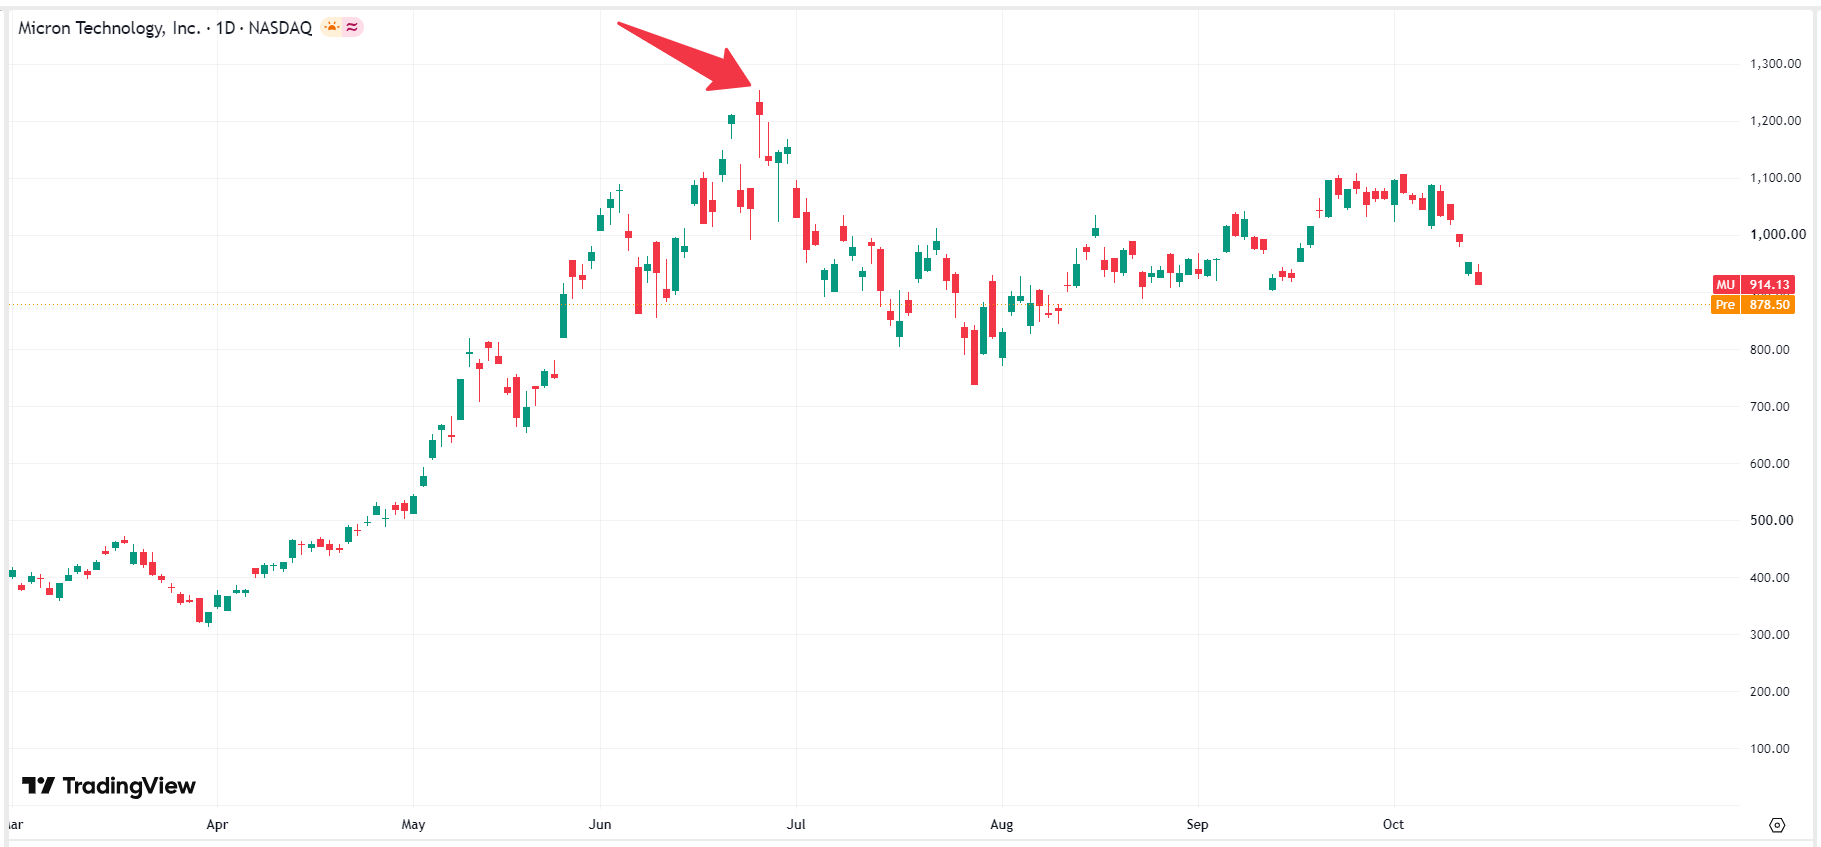
Micron Stock Price Chart, Source: TradingView
In August, Micron's stock price gradually rebounded and strengthened, climbing to near $1,100 in early October. However, it failed to hold at that level and subsequently fell back, successively breaking below key support levels such as $1,000 and $900, signaling a failed attempt to challenge its record high.
Why Is Micron Stock Falling?
Micron's failed attempt to reach a new all-time high was primarily driven by a triple whammy of a macro inflation surprise, sector-wide deleveraging, and market anxiety over peer competition. In early October, after Micron broke above $1,000, a massive volume of bullish options accumulated in the derivatives market. Amid a joint correction across the broader market and semiconductor leaders, a chain-reaction liquidation of high-level bullish leverage was triggered.
On October 10, major Chinese memory maker ChangXin Memory Technologies (CXMT) announced a technological breakthrough in 4F² DRAM architecture, sparking short-term market concerns over the future supply-demand structure and intensifying competition in the low-to-mid-end DRAM market. This prompted some institutional capital to raise cash from the memory sector, dealing a further blow to Micron's stock price.
On October 14, the US released September CPI data that exceeded expectations, with gains in crude oil and gasoline significantly driving up headline inflation. Expectations for Federal Reserve (Fed) monetary policy shifted toward tightening or delayed rate cuts, causing US Treasury yields to jump and putting pressure on high-valuation semiconductor stocks first. As a high-beta chip stock, Micron bore the brunt of programmatic selling by quantitative funds, with its stock price dropping below $900 once again.
Can Micron Stock Price Return to Record Highs?
Micron Technology's failure to reach a new all-time high and the stock's continued pullback are not due to deteriorating company fundamentals or the end of the AI memory cycle, but rather a typical phase of market shakeout triggered by a macro CPI inflation surprise and broad deleveraging across the tech sector. This means that as long as macro inflation sentiment is gradually digested from late October through November and U.S. Treasury yields stabilize, the extremely low valuation will attract massive institutional value buying back into the market, leaving a high probability that Micron's stock will return to its record high by year-end.
As a core memory supplier for Nvidia's next-generation AI architecture, Micron's HBM capacity for 2026 and 2027 has long been fully sold out to global tech giants. In addition, HBM product gross margins are significantly higher than those of traditional DRAM, which will continue to drive explosive growth in Micron's revenue and earnings per share (EPS) over the coming quarters. Currently, Micron's forward price-to-earnings (P/E) ratio has adjusted to an extremely low level of around 12.3x, which, relative to its explosive annual EPS growth potential of 70%+, indicates that the current stock price is significantly undervalued by the market, creating strong demand for upside.
Micron Stock Technical Analysis: Holding $740 Is Key
After experiencing a hotter-than-expected US CPI reading in early October, high-level deleveraging in the semiconductor sector, and a breach below the $900 mark, Micron's technical pattern is currently in an extreme retest phase of high-level, wide-range consolidation. Reviewing Micron's wave movement in 2026 shows that $740 was the lowest point of the pullback after hitting an all-time high, falling right on the key 61.8% support zone—a level that typically marks the end of an extreme shakeout.
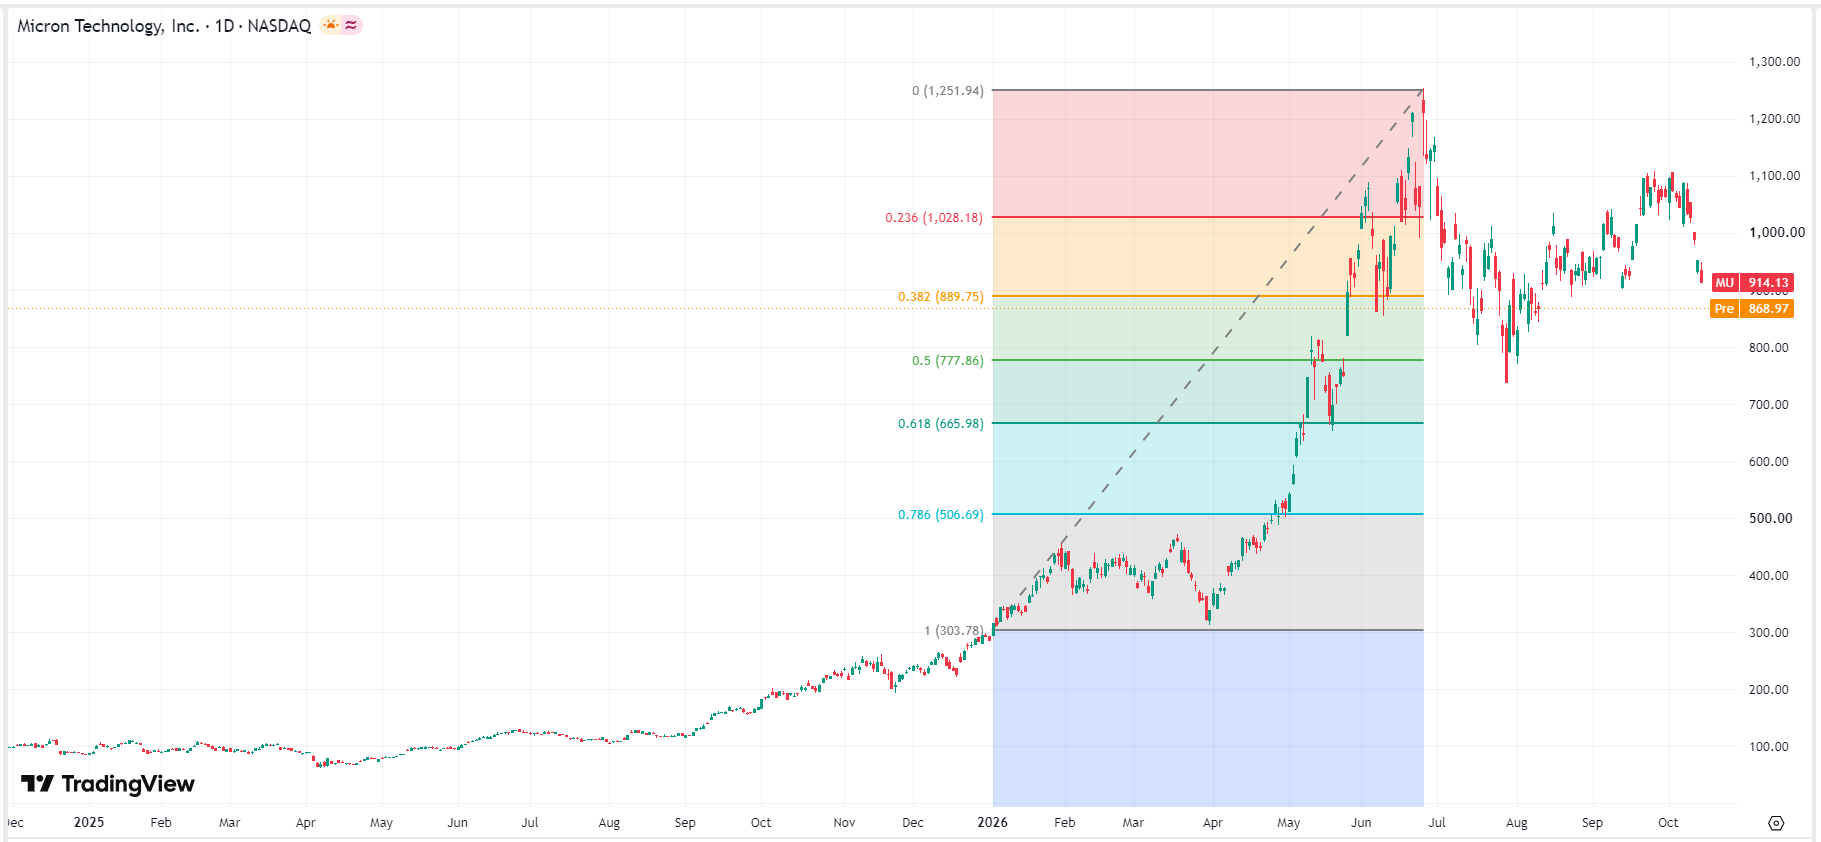 Micron stock price chart, Source: TradingView
If Micron's daily closing price decisively breaks below the previous low of $740, it will signal the failure of the massive high-level range-bound consolidation pattern since June, potentially triggering secondary risk-averse selling by long-term institutional funds and algorithmic trading, sending the stock down to test the next secondary support level of $650–$680.
Recommended Articles


