


4 Charts That Explain the Copper Supply Crunch Investors Should Watch
Key Points
Improving demand and the difficulties inherent in increasing supply favor a rising copper price environment.
Industry experts see a significant gap between demand and supply developing over time.
- 10 stocks we like better than Freeport-McMoRan ›
The case for copper and copper stocks like Freeport-McMoRan (NYSE: FCX) or a copper ETF like the Global X Copper Miners ETF (NYSEMKT: COPX) rests on the idea that demand will outstrip supply, putting upward pressure on the copper price. It's a strong argument for long-term investment in an industrial metal that's critical to the economy of the future. Here's why.
Demand will exceed supply.
According to an S&P Global report, "Copper in the Age of AI," copper demand will exceed the baseline supply, with a widening gap appearing after 2030. I've re-created a chart using the data. As you can see, copper supply is projected to start declining from about 2035, driven by pressures including:
Missed Nvidia in 2009? This Rare Signal Is Flashing Again. In 2009, a "Double Down" signal flashed for a little-known chipmaker called Nvidia. For the first time in years, that same "Total Conviction" signal is flashing for a company 1/100th the size of Nvidia. Continue »
- Declining ore grades
- Rising costs for energy and labor
- Mining complexity
- Difficulty of acquiring permits amid environmental activist pressure
While it's not impossible that some of these pressures can be relieved or even removed, it makes sense not to bake in any assumptions that they will be until there's hard evidence they're happening.
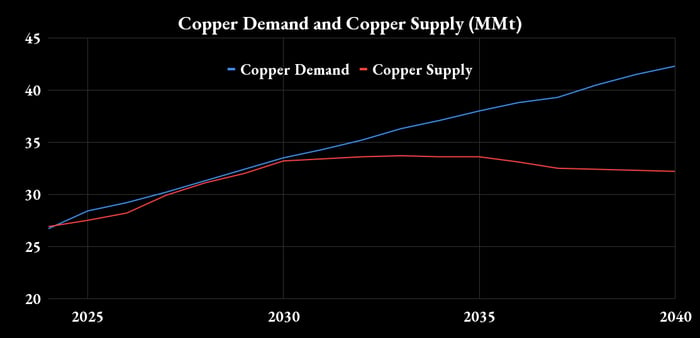
Data source: S&P Global. Chart by author. MMt is millions of metric tonnes.
Supply pressures
Increasing costs and declining ore grades, notably in the U.S. and Chile, are a constant feature of mining company presentations. For example, Freeport-McMoRan's CEO Kathleen Quirk recently told investors that some of its U.S. mines had "been around for over 100 years" and now had low grades, which forces the company to prioritize efficiency, including investments in automation and technologies such as its low-cost leaching initiative.
In addition, miners are using muon technology (cosmic rays from outer space) to better identify mining deposits,
Chile is the world's largest copper producer and accounts for almost a quarter of global production. The chart shows the deteriorating trend in the country's copper ore grades. This is something likely to create upward pressure on costs as well as potentially price some mining operations out of production, even as prices rise. It may also cause delays in investment as appraisals are made assuming declining ore grades.
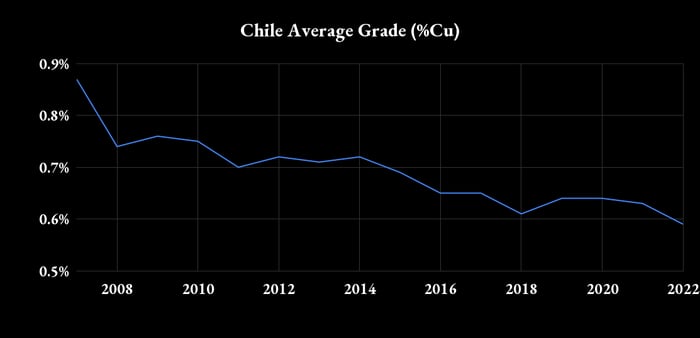
Data source: Chilean Copper Commission. Chart by author.
Nonnegotiable copper demand?
Usually, when supply exceeds demand and prices rise, there's additional impetus to develop technological or other solutions that can improve supply. I've already mentioned Freeport-McMoRan's leaching initiative, which management believes could ultimately recover 800 million pounds of copper per annum from existing stockpiles, compared with its 2028 copper sales expectation of 4.1 billion pounds.
In addition, at least in theory, a high price could cause a substitution effect, leading to the use of alternative materials. Furthermore, it could also cause some demand destruction.

Image source: Getty Images.
While these factors are highly likely to play a part, their impact might be muted, given that much of the projected demand for copper comes from sources that may prove non-negotiable.
The chart shows S&P Global's projections for copper demand; "energy transition & addition" includes transmission and distribution, renewable energy, and electric vehicles. Meanwhile, "AI & data centers" includes hyperscaler data centers, enterprise data centers, and robots.
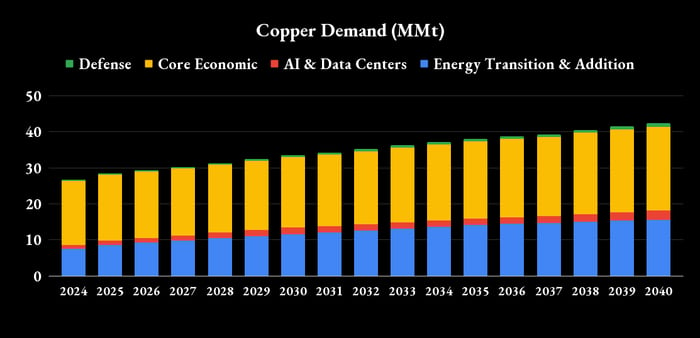
Data source: S&P Global, Chart by author. MMt is millions of metric tonnes.
The picture of incremental demand is better illustrated by this chart, which shows more than 60% of the incremental demand from 2024-2040 will come from AI and data centers and the energy transition. That demand might prove relatively inelastic.
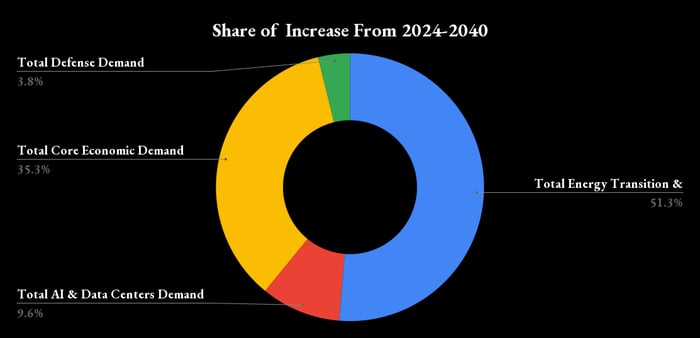
Data source: S&P Global. Chart by author.
A copper supply crunch coming?
Rising demand and pressure on supply imply a supply crunch, but history suggests technological improvements and the substitution effect will mitigate demand growth and improve supply. However, recent history also suggests permitting won't be easy, not least for greenfield sites, and that declining ore grades in mature copper mines in the U.S. and Chile are a real problem.
On balance, I'd rather be bullish than bearish on copper over the long term.
Should you buy stock in Freeport-McMoRan right now?
Before you buy stock in Freeport-McMoRan, consider this:
The Motley Fool Stock Advisor analyst team just identified what they believe are the 10 best stocks for investors to buy now… and Freeport-McMoRan wasn’t one of them. The 10 stocks that made the cut could produce monster returns in the coming years.
Consider when Netflix made this list on December 17, 2004... if you invested $1,000 at the time of our recommendation, you’d have $380,363!* Or when Nvidia made this list on April 15, 2005... if you invested $1,000 at the time of our recommendation, you’d have $1,315,732!*
Now, it’s worth noting Stock Advisor’s total average return is 919% — a market-crushing outperformance compared to 211% for the S&P 500. Don't miss the latest top 10 list, available with Stock Advisor, and join an investing community built by individual investors for individual investors.
See the 10 stocks »
*Stock Advisor returns as of October 17, 2026.
Lee Samaha has no position in any of the stocks mentioned. The Motley Fool has positions in and recommends S&P Global. The Motley Fool has a disclosure policy.
Recommended Articles


