


What History Reveals About Stock Market Crashes During Presidential Transitions
Key Points
Research from Citizens Bank shows that the S&P 500 tends to gain similar returns no matter which party is in the White House.
The Vanguard S&P 500 ETF has delivered 15% annualized returns for the past 16 years across four different presidencies.
- 10 stocks we like better than Vanguard S&P 500 ETF ›
The second presidential term of Donald Trump has reminded the world of how much a U.S. president can affect the global economy. The conflict in Iran has caused severe uncertainty about global oil supplies, raising energy costs and inflation. Other "Trumpflation" policies, like a trade war with Canada and tariffs on imported goods, have raised costs for businesses and consumers and helped push up long-term interest rates on U.S. Treasury bonds.
Despite some negative impacts of these Trump policies, the U.S. economy and stock market have remained resilient. The S&P 500 (SNPINDEX: ^GSPC) has gained about 28% since Trump was inaugurated on Jan. 20, 2025.
Missed AI’s "Act 1"? Act 2 Could Be 15x Bigger. Most investors think they missed the AI boat because they didn't buy Nvidia in 2005. But according to our analysts, we’re only at the end of "Act 1"—the R&D phase. "Act 2" is the global rollout. Continue »
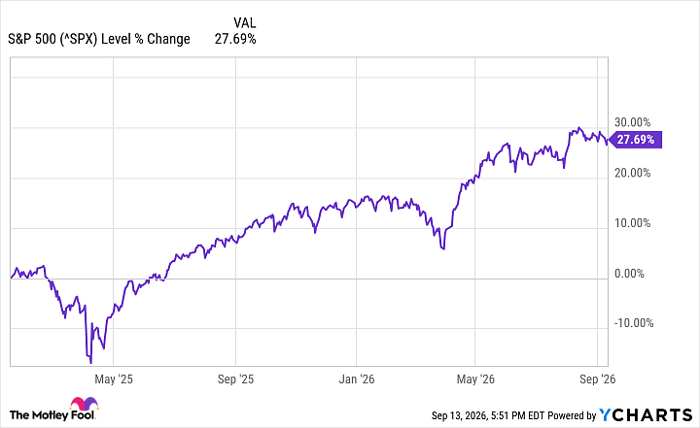
^SPX data by YCharts
Trump still has more than two years left in office, but with the 2026 midterm elections approaching in November, many investors might be looking ahead to the next president.
What do presidential transitions have to do with the stock market? Should you change your investments based on which president (or party) is in power in Washington, D.C.?
History shows us that, despite some short-term uncertainty, most of the time the U.S. stock market keeps growing in the long run -- no matter who's in charge in the White House.
Let's look at some lessons from presidential history and see what new presidents mean for your stock portfolio.
Image source: Getty Images.
Presidents don't matter (much) to the stock market
It's not fair to say that "presidents don't matter." Policy choices made in the White House affect many aspects of everyday life, national media narratives, and America's cultural mood. But as far as the stock market is concerned, who the president is might matter less than people think.
According to research from Citizens Bank, ever since 1927, the average annual return of the S&P 500 has been about the same in presidential election years as in non-election years. In most presidential election years, the S&P 500 tends to have higher volatility in the last few months leading up to Election Day in November. That's because, especially in a close election, investors may face significant uncertainty about which candidate will win, which policies will be implemented, and what that might mean for various industry sectors and companies.
But even though the stock market can wobble in the short term due to bad news or policy choices, the U.S. stock market has delivered strong returns across presidencies of both parties. Under President Barack Obama from 2009-2017, S&P 500 annualized returns were 13.8%. That's about the same as President Trump's first-term stock market performance, with 14% annualized returns during 2017-2021.
How to invest no matter who is president
During times of political division and stressful news headlines, it's easy to turn pessimistic about stocks. But long-term investors should take heart. Most of the time, over the long run, the S&P 500 delivers strong positive returns.
The Vanguard S&P 500 ETF (NYSEMKT: VOO) is one of the best ways to buy the 500 largest publicly traded U.S. companies. In the past 16 years, it has delivered average annual returns of 15%, and it's up about 20.3% in the past year.
No one knows what President Trump will do next or who might replace him in 2029. But the U.S. stock market isn't controlled by the president. It moves based on complex forces beyond any president's control, including economic growth, investor optimism, technological advancements, and millions of people voting with their money. No matter how you feel about any American president, it tends to pay to be bullish on American stocks.
Should you buy stock in Vanguard S&P 500 ETF right now?
Before you buy stock in Vanguard S&P 500 ETF, consider this:
The Motley Fool Stock Advisor analyst team just identified what they believe are the 10 best stocks for investors to buy now… and Vanguard S&P 500 ETF wasn’t one of them. The 10 stocks that made the cut could produce monster returns in the coming years.
Consider when Netflix made this list on December 17, 2004... if you invested $1,000 at the time of our recommendation, you’d have $420,109!* Or when Nvidia made this list on April 15, 2005... if you invested $1,000 at the time of our recommendation, you’d have $1,303,689!*
Now, it’s worth noting Stock Advisor’s total average return is 938% — a market-crushing outperformance compared to 211% for the S&P 500. Don't miss the latest top 10 list, available with Stock Advisor, and join an investing community built by individual investors for individual investors.
See the 10 stocks »
*Stock Advisor returns as of September 16, 2026.
Ben Gran has no position in any of the stocks mentioned. The Motley Fool has positions in and recommends Vanguard S&P 500 ETF. The Motley Fool has a disclosure policy.
Recommended Articles


