


How Will US Stocks Perform If the Fed Hikes? Three Major Indexes Fell Then Rose After Last Rate Hike
TradingKey - At 2:00 p.m. Eastern Time on September 16, the Federal Reserve will announce its interest rate decision. According to a report by The Wall Street Journal, the rate-hike probability implied by interest rate futures rose to 95% on September 14, up from 87% on the previous trading day. Data cited by Reuters over the same period was around 90%. Overall, the market strongly expects the Federal Reserve to raise interest rates by 25 basis points at this meeting.
The Federal Reserve currently maintains the target range for the federal funds rate at 3.50% to 3.75%. If it raises rates by 25 basis points, the target range will rise to 3.75% to 4.00%, marking its first rate hike since July 2023. Going forward, the market will focus on how the Fed explains this move, and whether it represents a standalone policy adjustment or the starting point for subsequent rate hikes.
How Fed Rate Hikes Affect US Stocks
Rate hikes typically raise financing costs and discount rates for stock valuations. As bond yields rise, U.S. Treasuries become more attractive to capital, making highly valued growth stocks, real estate stocks, and heavily indebted companies more vulnerable to impact.
What makes this market cycle unique is the large scale of AI infrastructure investment, with spending covering data centers, chips, networking equipment, and power facilities. Rising interest rates will raise corporate requirements for project returns and increase financing costs for data center operators, energy companies, and related suppliers.
If the Federal Reserve hints at further rate hikes ahead, short-term U.S. Treasury yields may continue to rise, putting stock valuations under further pressure. Long-term U.S. Treasury yields and U.S. stock performance will also be affected by inflation, economic growth, and corporate earnings.
If the policy statement does not signal consecutive rate hikes, market focus will shift to upcoming inflation and employment data, as well as whether the Federal Reserve will continue to raise interest rates.
How Did the Three Major Indexes Perform After the Last Fed Rate Hike?
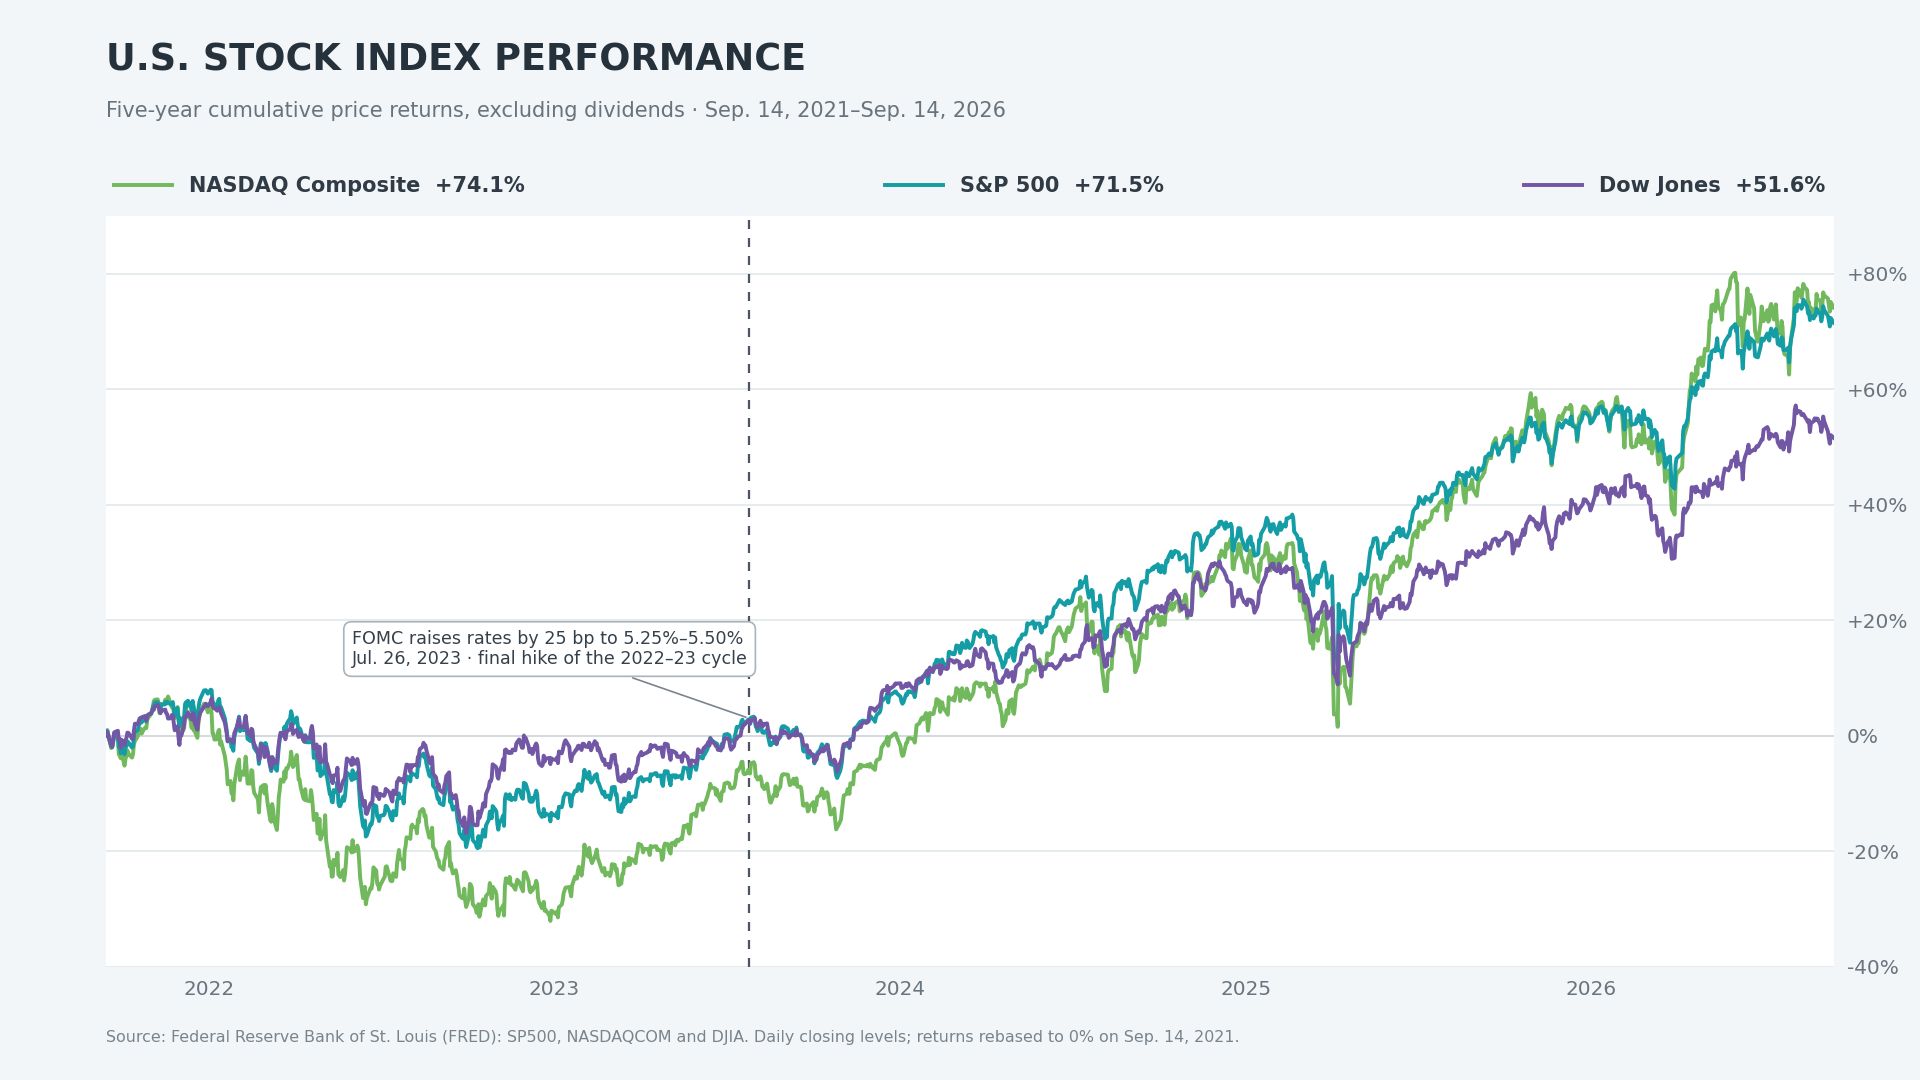
As of September 14, 2026, the Federal Reserve's last rate hike occurred on July 26, 2023. At that time, the target range for the federal funds rate was raised by 25 basis points to 5.25%–5.50%, which also marked the final rate hike of that tightening cycle.
The following percentage changes are calculated based on the closing levels of the three major price indexes, excluding dividend yields.
On August 25, 2023, the nearest trading day about one month later, the S&P 500 Index fell 3.5% from the day of the rate hike, while the Nasdaq Composite Index dropped 3.8% and the Dow Jones Industrial Average fell 3.3%.
Three months later, on October 26, 2023, losses across the three major indexes widened further: the S&P 500 fell 9.4%, the Nasdaq dropped 10.8%, and the Dow fell 7.7%.
By January 26, 2024, six months later, all three major indexes had recovered their previous losses. The S&P 500, Nasdaq, and Dow gained 7.1%, 9.4%, and 7.3%, respectively, compared with the day of the rate hike.
One year later, on July 26, 2024, the cumulative gains of the three major indexes expanded to 19.5%, 22.9%, and 14.3%, respectively.
As of the close on September 14, 2026, the S&P 500 was up a cumulative 66.9% compared with July 26, 2023, while the Nasdaq rose 85.4% and the Dow gained 47.6%.
Short Term May Face Pressure, Medium Term Still Hinges on Corporate Earnings
According to statistics from the Goldman Sachs (GS) strategy team on multiple rate hike cycles over past decades, the average return of the S&P 500 Index was about -2% in the three months following the Federal Reserve's first rate hike; extending the observation period to 12 months, the average return was approximately 9%.
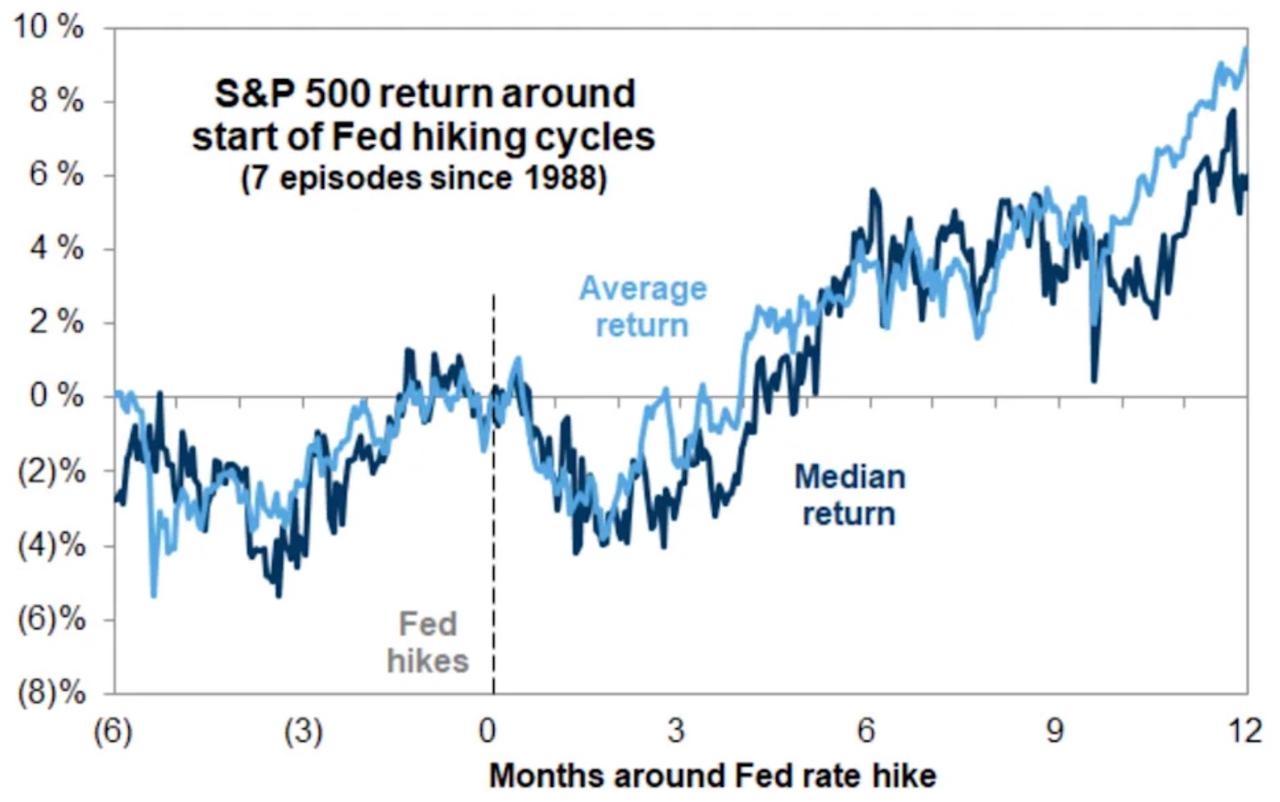
[Source: Goldman Sachs]
Goldman Sachs' statistical analysis focuses on market performance after the initiation of a rate hike cycle, whereas July 2023 marked the final rate hike of the previous tightening cycle, representing different policy stages.
If interest rates are hiked this time, it will mark the Federal Reserve's first increase following rate cuts. The number of subsequent rate hikes, 10-year U.S. Treasury yields, inflation trends, and corporate earnings will jointly influence the performance of U.S. stocks.
In the short term, interest rate expectations may continue to weigh on higher-valuation stocks. In the medium term, if the economy continues to grow and corporate earnings growth is sufficient to offset the pressure from rising discount rates, U.S. stocks may rebound after a correction; if consecutive rate hikes weaken demand and earnings expectations, the market correction could persist.
Recommended Articles


