

USD/CHF Price Forecast: RSI and MACD signal firm upside momentum

Source Fxstreet
  • USD/CHF advances for a fifth straight day as Fed rate hike expectations support the US Dollar.
  • Bullish momentum strengthens as the pair holds above the 50-day, 100-day and 200-day SMAs.
  • A decisive break above 0.8200 would bring the 0.8350 resistance level into focus.

USD/CHF extends its advance for a fifth consecutive day on Tuesday as the US Dollar (USD) stays firmly bid ahead of the Federal Reserve’s (Fed) monetary policy announcement on Wednesday. At the time of writing, the pair trades around 0.8191, near levels last seen on July 29.

The US Dollar Index (DXY), which tracks the Greenback’s value against a basket of six major currencies, trades around 99.60, up 0.11% on the day and close to a two-week high.

Markets are almost fully pricing in a 25-basis-point (bps) rate hike, which would be the central bank’s first increase since 2023. Elevated Oil prices linked to the war in the Middle East are adding to inflationary pressures, lifting US Treasury yields and strengthening expectations that borrowing costs will remain elevated for longer.

Against this backdrop, the Swiss Franc (CHF) remains vulnerable to additional losses. The currency was among the worst performers last quarter as Switzerland’s low-inflation environment allowed the Swiss National Bank (SNB) to keep its policy rate at 0%.

The wide interest rate differential encourages investors to use the Swiss Franc as a funding currency, driving flows toward higher-yielding currencies such as the US Dollar and keeping USD/CHF supported.

Technical analysis
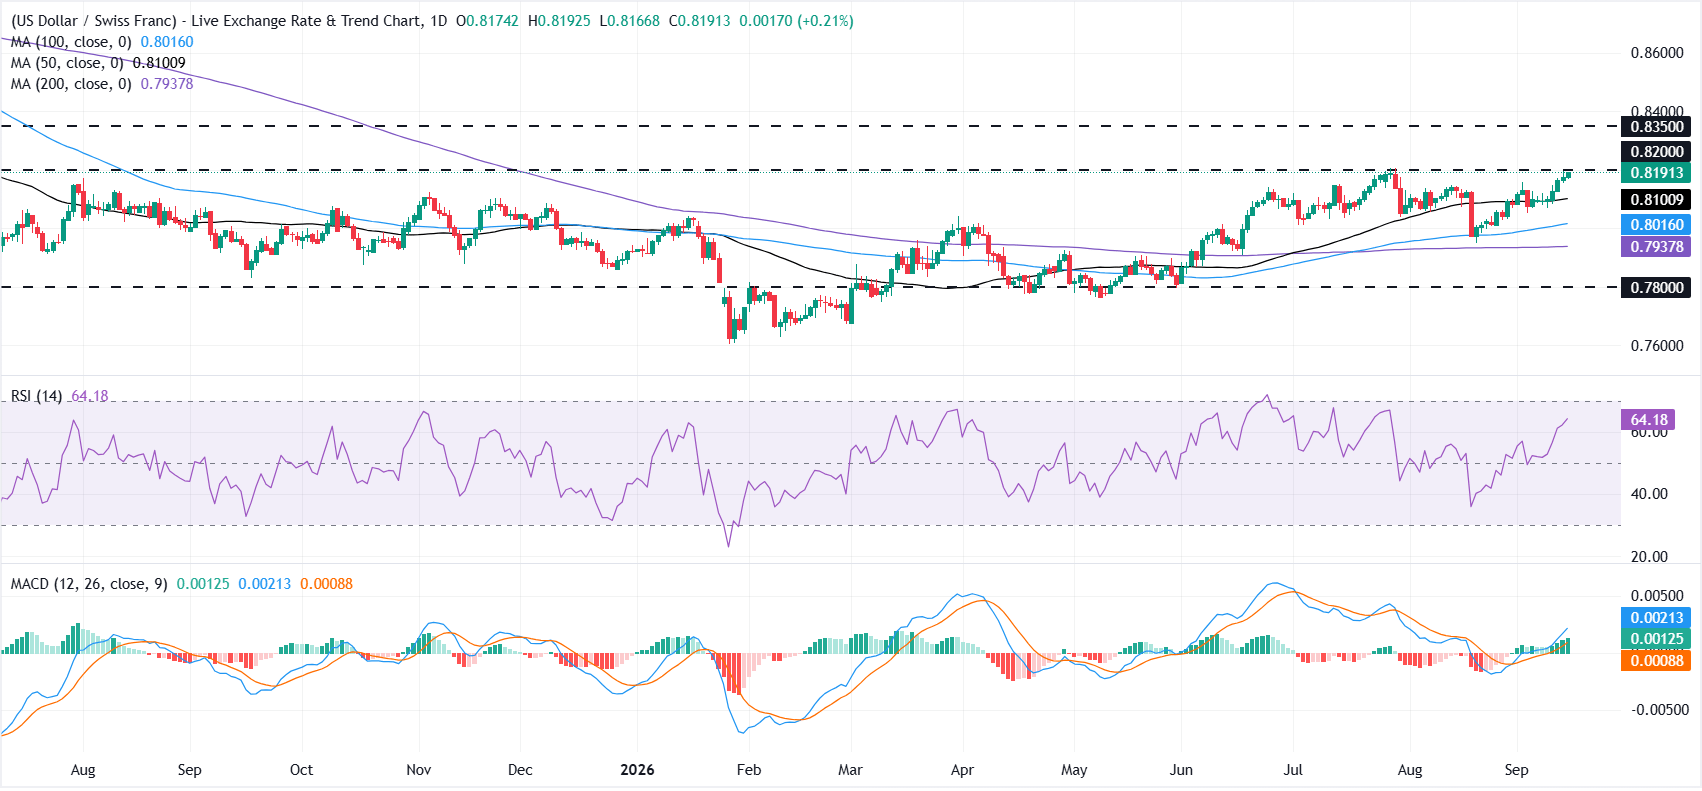
On the daily chart, USD/CHF maintains a constructive bullish bias as it holds above the 50-day, 100-day and 200-day Simple Moving Averages (SMAs) clustered between roughly 0.81 and 0.79.

The Relative Strength Index (RSI) at about 64 and a positive, rising Moving Average Convergence Divergence (MACD) line both suggest firming upside momentum, though the pair is edging toward nearby resistance and could face some consolidation if gains stall.

On the topside, initial resistance is the horizontal cap at 0.8200, with a subsequent barrier at 0.8350 that would need to give way to extend the recovery.

On the downside, immediate support is provided by the 50-day SMA near 0.8101, followed by the 100-day SMA around 0.8016 and the 200-day SMA near 0.7938, while a deeper slide would look to the prior horizontal floor at 0.7800 to contain any corrective pullback.

(The technical analysis of this story was written with the help of an AI tool. Know more.)

Disclaimer: For information purposes only. Past performance is not indicative of future results.
placeholder
US August CPI lands tonight: after a 5.4% PPI shock, will the Fed hike on September 16?US August PPI came in at 5.4% year-on-year, above the 5.3% consensus, with core PPI at 4.6%. Traders have pushed the odds of a 25bp Fed hike on September 15-16 to around 70%. Tonight's CPI is the last major inflation print before the decision — here is the full calendar, the consensus numbers, and what a hot versus cool reading would mean for the dollar, yields, gold and stocks.
Author  Irene Q.
Sep 11, Fri
US August PPI came in at 5.4% year-on-year, above the 5.3% consensus, with core PPI at 4.6%. Traders have pushed the odds of a 25bp Fed hike on September 15-16 to around 70%. Tonight's CPI is the last major inflation print before the decision — here is the full calendar, the consensus numbers, and what a hot versus cool reading would mean for the dollar, yields, gold and stocks.
placeholder
Brent tests $108 as a key export pipeline stays shut — can the rally clear $110?Brent crude rose 2.55% to $106.97 and WTI 2.32% to $102.30 as a major regional export pipeline remained offline with no restart timeline. Front-month backwardation has widened to $5.53 from $3.84 a week ago, European gas is at its highest since December 2022, and one analyst sees $119.48 if talks stall.
Author  Irene Q.
Yesterday 07: 16
Brent crude rose 2.55% to $106.97 and WTI 2.32% to $102.30 as a major regional export pipeline remained offline with no restart timeline. Front-month backwardation has widened to $5.53 from $3.84 a week ago, European gas is at its highest since December 2022, and one analyst sees $119.48 if talks stall.
placeholder
Fed hike odds near 90% into Wednesday's decision — how to trade the dollar, gold and the S&P 500A 0.3% monthly core CPI print has lifted the market-implied probability of a 25bp Fed hike on 16 September to roughly 86.5% ~ 90%, which would be the first increase since July 2023. Here is the decision timeline, the pricing versus the forecasts, both scenarios, and the key levels for the dollar, gold and the S&P 500.
Author  Suzie
Yesterday 07: 49
A 0.3% monthly core CPI print has lifted the market-implied probability of a 25bp Fed hike on 16 September to roughly 86.5% ~ 90%, which would be the first increase since July 2023. Here is the decision timeline, the pricing versus the forecasts, both scenarios, and the key levels for the dollar, gold and the S&P 500.
placeholder
Silver Price Forecast: XAG/USD falls to near $63.50 amid Fed hike bets, higher oil pricesSilver price (XAG/USD) loses its gains from the previous day, trading around $63.50 per troy ounce during Asian hours on Monday. Non-yielding Silver is currently facing significant headwinds driven by rising Federal Reserve (Fed) rate-hike expectations for the upcoming September decision.
Author  FXStreet
Yesterday 10: 37
Silver price (XAG/USD) loses its gains from the previous day, trading around $63.50 per troy ounce during Asian hours on Monday. Non-yielding Silver is currently facing significant headwinds driven by rising Federal Reserve (Fed) rate-hike expectations for the upcoming September decision.
placeholder
【Daily Brief】10-year Treasury yield briefly tops 5%, S&P 500 slips to 7,602 and the dollar firms at 99.3 as the Fed's decision eve beginsThe 10-year Treasury yield touched 5.014% on Monday — its first print above 5% since October 2023 — while the S&P 500 closed 0.48% lower at 7,619.98 and the dollar index firmed to 99.3. Here is the full market wrap ahead of Wednesday's FOMC decision, the dot plot and the August retail sales report, plus today's CLARITY Act Senate vote.
Author  Irene Q.
7 hours ago
The 10-year Treasury yield touched 5.014% on Monday — its first print above 5% since October 2023 — while the S&P 500 closed 0.48% lower at 7,619.98 and the dollar index firmed to 99.3. Here is the full market wrap ahead of Wednesday's FOMC decision, the dot plot and the August retail sales report, plus today's CLARITY Act Senate vote.
Related Instrument
goTop
quote