


JPMorgan Stock Holds $348 Ahead of Fed Week as Bulls Eye $356
TradingKey - JPMorgan enters September 11 with the last close at $353.56 (vs. $353.55 chart reference) and down about 1.4% from the previous Friday’s close. However, the stock has given back recent gains and is trading around $353.56, which is above support at $348.97. Next week will be the first of two events which make the outlook for JPMorgan especially macro sensitive. First, the Barclays Global Financial Services Conference, at which JPMorgan will present on September 15. Second, the FOMC meetings, on September 15 and 16, which markets currently see as carrying a substantial probability of another rate hike.
Q2 Underlying Earnings Were Exceptional
JPMorgan reported some very strong quarterly results, posting $21.2B of net income and $7.70 of reported EPS. However, the more important number is the adjusted result: after exclusions for the $4.6B gain related to Visa and $1B in equity gains, the bank's net income was more like $16.9B, or $6.14 per share, with an adjusted ROTCE of 23%.
That is the number I want to focus on for the weekend. JPMorgan is not using any suspect accounting to support the numbers. The earnings engine for the business is exceptionally strong for lending, markets, investment banking, and payment processing, plus services to high-net-worth clients.
Capital Markets Momentum Remains a Major Advantage
Fees for Investment banking were up 30% compared to last year, and Markets revenue also increased by 35%. Equity Markets revenue were up by 86% and JPMorgan continued to hold the top position in global investment-banking fees.
Here's why this is important for what’s to come. A volatile rate environment creates a risk reward environment. Orderly markets mean traders take advantage of increased volatility. Rapid movement in yields, however, creates chaos in deal making, making the same macro environment a challenge.
Net Interest Income Could Benefit From Higher Rates
JPMorgan already revised their estimates upward for FY2026 after the second quarter. The NII, or net interest income, with markets excluded, is anticipated at $96.5 billion, while total NII is expected at $105.5 billion.
There was a revision in guidance before the Treasury auction, which ultimately saw upward movement in yields in the U.S. market towards the 5 percent level with traders adding to the probability for a Fed rate hike on September 15, 2026.
Higher yields on assets should offer support to the other side of the equation, but support depends on pricing for deposits and costs of funding.
All of this makes Tuesday and Wednesday even more important. if Management comments on the stability of deposits and the credit environment while interest rates continue to move higher, investors will likely place bets on positive revisions to NII.
Loan and Deposit Growth Show Market-Share Gains
Average loans grew 10% year over year in Q2, while deposits increased 7%. Banking and Payments loans rose 13%, and Asset & Wealth Management loans increased 18%.
This is an indication of strength in the market since banks typically have challenges increasing lending with elevated borrowing costs. JPMorgan is clearly using its size, deposit franchise and healthy balance sheet to gain market share even in a difficult interest rate environment.
Manageable consumer credit continues. Q2 credit costs were $2.5 billion, and the retained card net charge-off rate improved to 3.34%. The biggest concern is what happens in the future if oil staying above $100 combined with another Fed hike starts putting stress on consumer spending.
Capital Returns Strengthen the Bull Case
JPMorgan ended Q2 with a 14.1% standardized CET1 ratio, far exceeding their regulatory requirement. After passing the Fed’s stress test, the bank increased their quarterly dividend from $1.50 to $1.65 and authorized a new $50 billion share-repurchase plan.
This capital flexibility is important with JPM trading no longer as a cheap stock. Currently trading at about 3.1 times tangible book value, JPM is also priced at a premium to historically low bank valuations. The valuation continues to be dependent upon positive operating results. Meanwhile, the bank is in a great position to further increase shareholder value through share buybacks and dividends.
Next Week’s Catalysts: Barclays and the Fed
The first company-specific market moving event comes on September 15 when JPMorgan participates in the Barclays Global Financial Services Conference at 2:45 p.m. ET. Potential key areas of interest are management comments on NII, capital markets, deposit pricing, credit, and expense trends.
The main macro event is the Feds meeting on September 15-16. Markets attribute a considerable probability to another rate increase after recent firmer inflation and oil-related price hikes. As of September 11, futures pricing implied roughly a two-thirds chance of a 25-basis-point hike. For JPMorgan, a moderate rate hike with stable growth expectations could be beneficial. With more aggressive tightening signaling, the probability of consumer stress and slower corporate activity increases.
This makes the setup for this weekend less about going for a breakout and more about seeing if the stock is able to maintain its technical structure through a catalyst that is expected to be volatile.
JPMorgan Technical Analysis: $348.97 Is the Key Support for Next Week
On September 10, JPM closed at $353.56, just above the reference at $353.55. The 2-hour chart remains constructive as price continues to hold above the rising trendline and $348.97 support on some consolidation from $361.35.
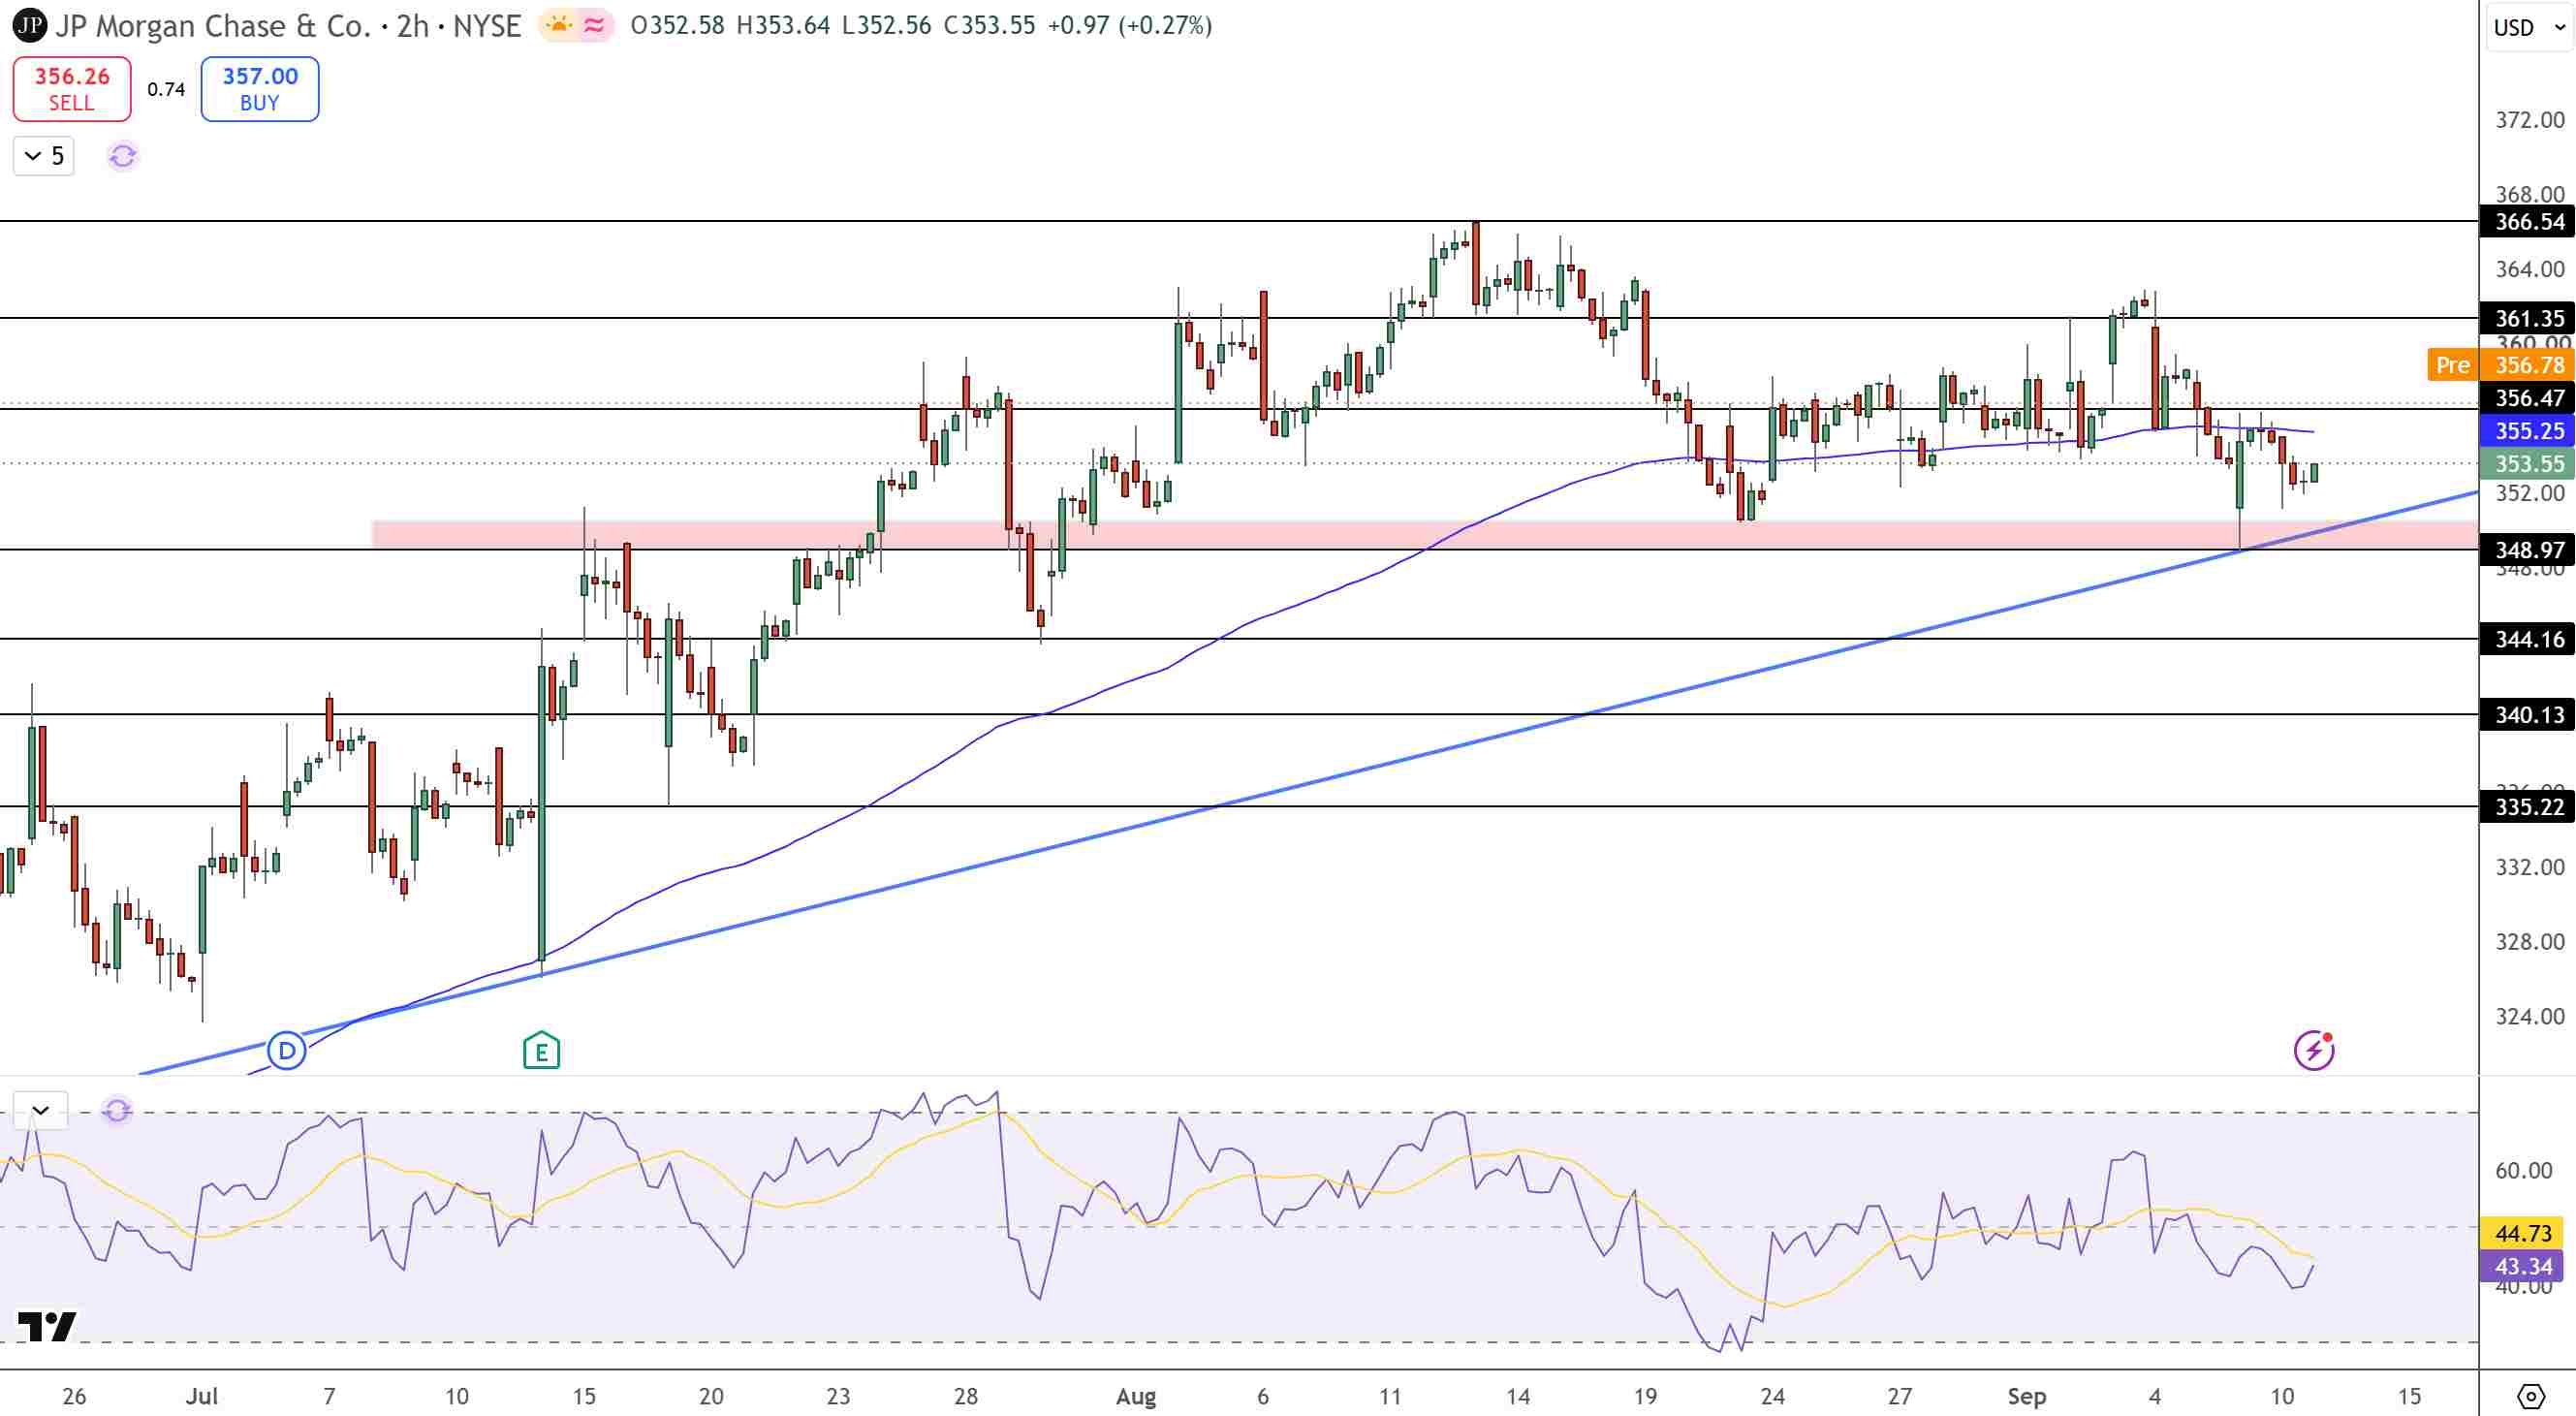
JPMorgan Stock Price Chart - Source: Tradingview
The first of the visible barriers is the moving average at around $355.25. A 2-hour close above $356.47 will improve the bullish structure and bring back $361.35. Above $361.35 could be a run to $366.54.
For now, the RSI at 43 is around the signal line at 45, giving the sellers a very slight edge for now. This is not considered oversold and leaves a bit more room to test the support.
On the other side of the coin, $348.97 is the key level. A solid break down of the rising trendline would bring sellers back in focus to the level of $344.16 and $340.13.
Key Levels
· Latest completed close: Around $353.56
· Key trendline support: $348.97
· Moving-average resistance: $355.25
· Breakout confirmation: $356.47
· First upside target: $361.35
· Higher target: $366.54
· Secondary support: $344.16
· Deeper support: $340.13
· RSI: Around 43, subdued but not oversold
Why is JPMorgan stock in focus for next week?
JPM has positioned itself strongly ahead of an important macro week with several key elements - super earnings, upgraded NII guidance, and a solid capital position. Events ahead next week include the Barclays conference and the September FOMC meeting which could materially shift expectations about NII, credit, and markets revenue.
What level confirms further JPM upside?
Once JPM closes 2 hours above $356.47, the recovery framework will have improved, inviting a test of $361.35 and $366.54. On the other hand, falling below $348.97 supports the short-term bias being sell.
Bottom Line
When looking at everything that's been discussed, I believe JPM is a good quality bank entering a risky macro week. As is, the business isn't bad, adjusting the earnings of Q2 to $16.9 billion, a 23% ROTCE, 10% growth in loans, increased NII and a $50 billion buyback authorization. The concern is the near 5% Treasury yields and the Fed potentially increasing interest rates again, which prior to this week was helping earnings, but now is starting to become a credit and demand issue. I will still be cautiously bullish until $348.97 is broken, but if it holds, I am more positive on a potential test of $361.35 and $366.54 at the start of trading next week.
Recommended Articles


