


The Stock Market Has Done This Only 2 Times Since 1871 — and Both Times Ended Badly. Could Trump’s Policies Raise the Risk of Another Market Meltdown?
Key Points
The S&P 500 Shiller CAPE ratio has topped 35 only twice before now.
Trump's policies could be increasing the risk of a stock market decline.
However, the underlying market dynamics are different than in the past.
- 10 stocks we like better than S&P 500 Index ›
Investors could be in store for a fourth consecutive year of double-digit gains. The S&P 500 (SNPINDEX:^GSPC) is near its all-time high. What's there to worry about? Perhaps more than meets the eye.
For one thing, the stock market is doing something seen only two times since 1871 -- and both of those times ended badly. The White House's actions further complicate matters. Is President Trump raising the risk of another stock market meltdown?
Missed Nvidia in 2009? This Rare Signal Is Flashing Again. In 2009, a "Double Down" signal flashed for a little-known chipmaker called Nvidia. For the first time in years, that same "Total Conviction" signal is flashing for a company 1/100th the size of Nvidia. Continue »

Image source: Official White House Photo by Molly Riley.
What history shows about expensive markets
Economist Robert Shiller created the S&P 500 Shiller CAPE (cyclically adjusted price-to-earnings) ratio to smooth out short-term noise in market valuations. He decided to use a 10-year moving average of inflation-adjusted price-to-earnings ratios. And his valuation metric has been remarkably accurate in predicting significant stock market downturns.
The S&P 500 Shiller CAPE ratio has risen above 35 only twice previously over the past 155 years. The first time the ratio breached the threshold was in late 1999 and early 2000. Corporate earnings multiples had skyrocketed due to the internet boom of the 1990s.
Every student of stock market history knows what happened next. Roughly four years after former Federal Reserve Chair Alan Greenspan famously used the phrase "irrational exuberance," the dot-com bubble burst. The S&P 500 and other major market indexes plunged. It took years for them to fully recover.
The next time the S&P 500 Shiller CAPE ratio topped 35 was in 2021. By the end of the year, the metric was above 38. Then the Fed began jacking up interest rates to fight soaring post-pandemic inflation. The stock market promptly sank, with the S&P 500 entering a bear market.
That leads us to today. The S&P 500 Shiller CAPE ratio now stands at slightly above 41. This is the highest level that Shiller's valuation metric has reached since the peak of the dot-com bubble. If history repeats itself, another significant market downturn could be on the way.
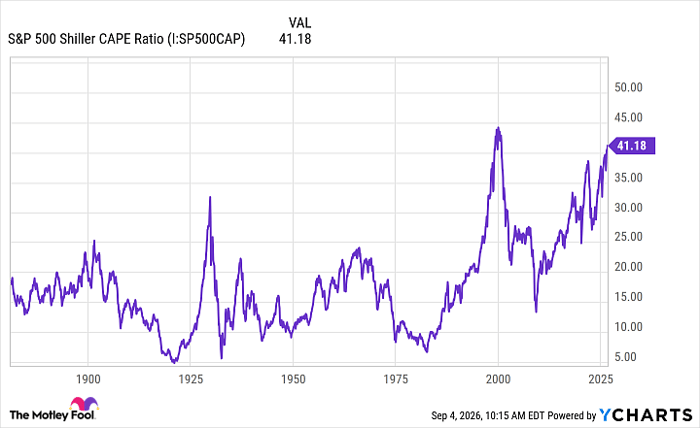
S&P 500 Shiller CAPE Ratio data by YCharts
Are Trump's policies making it worse?
President Trump has levied steep tariffs so far in his second term. When the U.S. Supreme Court struck down his tariffs under the International Emergency Economic Powers Act (IEEPA), Trump used other authorities to impose new tariffs.
The president has maintained that other countries pay the tariffs. However, several studies have found that U.S. businesses and consumers are paying most of the higher costs resulting from his tariffs. This is driving higher inflation, even if only temporarily.
Trump also initiated the U.S. attack on Iran. This war caused oil prices to skyrocket, pushing up energy prices for Americans. Worries about inflation have led CME Group's (NASDAQ:CME) FedWatch to boost the odds of a Fed rate hike by year-end to 87%. Interest rate increases catalyzed the 2022 bear market.
The U.S. Treasury Department's move to repurchase older long-dated bonds and issue new, shorter-term bonds is also contributing to market uncertainty. The strategy has caused long-term yield volatility, creating an additional headwind for stock valuations at a time when the elevated CAPE ratio leaves little cushion.
The verdict
The verdict seems to be an easy one: The Trump administration's policies could increase the risk of a significant stock market decline. However, there are two important caveats.
First, Trump's policies did not cause the S&P 500 Shiller CAPE ratio to reach its second-highest level ever. For that matter, neither did the Biden administration's policies.
Second, robust corporate earnings growth could reduce the predictive power of the S&P 500 Shiller CAPE ratio relative to previous periods when the ratio topped 35. FactSet even found that strong earnings growth is pushing the S&P 500's forward earnings multiple down rather than up.
The bottom line is that just because high S&P 500 Shiller CAPE ratios have preceded sharp stock market downturns in the past doesn't mean that a major sell-off is necessarily on the way anytime soon. History may not repeat itself because of the different underlying market dynamics. And these dynamics could trump any negative impacts of the White House's policies.
Should you buy stock in S&P 500 Index right now?
Before you buy stock in S&P 500 Index, consider this:
The Motley Fool Stock Advisor analyst team just identified what they believe are the 10 best stocks for investors to buy now… and S&P 500 Index wasn’t one of them. The 10 stocks that made the cut could produce monster returns in the coming years.
Consider when Netflix made this list on December 17, 2004... if you invested $1,000 at the time of our recommendation, you’d have $421,997!* Or when Nvidia made this list on April 15, 2005... if you invested $1,000 at the time of our recommendation, you’d have $1,413,876!*
Now, it’s worth noting Stock Advisor’s total average return is 978% — a market-crushing outperformance compared to 213% for the S&P 500. Don't miss the latest top 10 list, available with Stock Advisor, and join an investing community built by individual investors for individual investors.
See the 10 stocks »
*Stock Advisor returns as of September 6, 2026.
Keith Speights has no position in any of the stocks mentioned. The Motley Fool has positions in and recommends CME Group. The Motley Fool has a disclosure policy.
Recommended Articles


