


As the Stock Market Flashes a Warning Signal Only Witnessed 2 Times in 155 Years, Warren Buffett Delivers a Blunt Message to Investors.
Key Points
Warren Buffett has delivered an investing win over time, and investors listen closely to his words.
Stocks have climbed in recent years, and that’s positive. But a recent trend has worried Buffett.
- 10 stocks we like better than S&P 500 Index ›
The S&P 500 has blasted higher over the past few years, with artificial intelligence (AI) stocks leading the way in this bull market. Over the past three calendar years, the famous benchmark has advanced 78%, and the momentum has generally continued this year, with the index heading for a 13% increase.
All of this has helped investors score many wins, but one of the world's most successful investors isn't exactly happy with what he's seeing these days. Warren Buffett delivered a track record of six decades of market-beating gains as chief executive officer at Berkshire Hathaway. The billionaire retired from that position at the start of this year, but he remains chairman and continues to be involved in investing.
Missed Nvidia in 2009? This Rare Signal Is Flashing Again. In 2009, a "Double Down" signal flashed for a little-known chipmaker called Nvidia. For the first time in years, that same "Total Conviction" signal is flashing for a company 1/100th the size of Nvidia. Continue »
And as the stock market flashes a warning signal only witnessed twice in 155 years, Buffett takes notice. Against this backdrop, this stock market legend has delivered a blunt message to investors.

Image source: The Motley Fool.
Buffett's strategy
First, let's talk quickly about Buffett's investment strategy. Buffett, often called the "Oracle of Omaha," generated fantastic returns thanks to his commitment to certain investment principles he has stuck to regardless of the market environment. Buffett believes in buying quality stocks for reasonable prices -- he particularly likes picking up bargains -- and holding onto them for the long term. A great example of this is his investment in Coca-Cola. He opened a position in the beverage giant in the late 1980s and has held onto it ever since. In fact, Coca-Cola remains among Berkshire Hathaway's top five positions.
This top investor also isn't influenced by others, so he doesn't follow market trends. You won't find him rushing to buy the latest popular stock in a bull market or fleeing stocks during a bear market. In fact, Buffett often goes against the trends, looking for quality stocks that have fallen out of favor or haven't yet gained favor. The idea is to invest early when the price is right and then benefit as the rest of the market discovers the stock.
Now, let's consider the current market environment and Buffett's recent warning. As mentioned, the S&P 500 has soared amid this AI revolution and generally bullish environment. Meanwhile, some headwinds, such as concerns about rising inflation and turmoil in Iran, have slowed momentum at times.
The S&P 500 Shiller CAPE ratio
But the overall increase in the market has resulted in one thing in particular. The stock market now is flashing a warning signal only seen twice in 155 years, and it says: Stocks are historically expensive. The S&P 500 Shiller CAPE ratio has reached beyond the level of 41 -- something it's only done once before, during the dot-com boom.
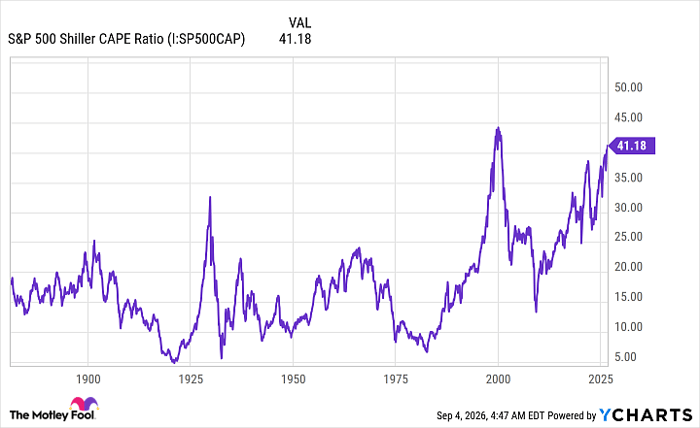
S&P 500 Shiller CAPE Ratio data by YCharts
The Shiller CAPE ratio is a reliable valuation measure as it considers stock price relative to earnings per share over a 10-year period to account for economic fluctuations. Today, this measure tells us that stocks are trading at their loftiest levels, and history shows us declines often follow.
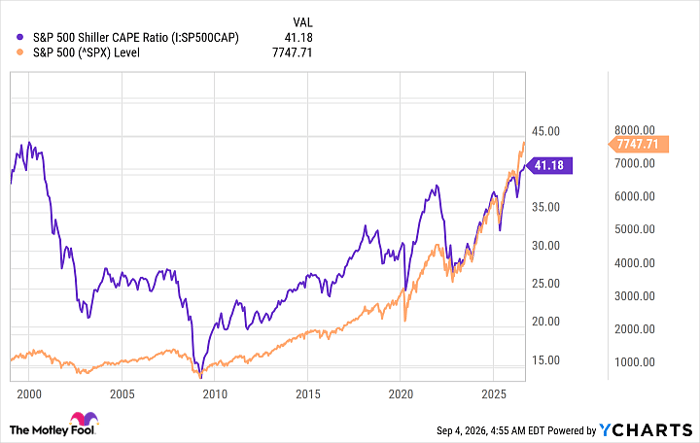
S&P 500 Shiller CAPE Ratio data by YCharts
As for Buffett, just a few months ago, in an interview with CNBC, the billionaire said that many market participants are "gambling," and this "gambling mood" is at a peak.
"If you're buying one-day options or selling them, that's not investing, it's not speculating -- it's gambling," Buffett said.
This trend in the market, along with current high valuations, could result in the stock market following a frequent historical pattern -- and declining.
What does this mean for you as an investor right now? It doesn't mean you should flee the market. Instead, as always, it's important to consider a stock's valuation and the company's financial health and prospects further down the road before buying. When you do this and commit to holding onto a stock for the long term, you're investing like Buffett and may find opportunities in any market environment.
Should you buy stock in S&P 500 Index right now?
Before you buy stock in S&P 500 Index, consider this:
The Motley Fool Stock Advisor analyst team just identified what they believe are the 10 best stocks for investors to buy now… and S&P 500 Index wasn’t one of them. The 10 stocks that made the cut could produce monster returns in the coming years.
Consider when Netflix made this list on December 17, 2004... if you invested $1,000 at the time of our recommendation, you’d have $421,997!* Or when Nvidia made this list on April 15, 2005... if you invested $1,000 at the time of our recommendation, you’d have $1,413,876!*
Now, it’s worth noting Stock Advisor’s total average return is 978% — a market-crushing outperformance compared to 213% for the S&P 500. Don't miss the latest top 10 list, available with Stock Advisor, and join an investing community built by individual investors for individual investors.
See the 10 stocks »
*Stock Advisor returns as of September 6, 2026.
Adria Cimino has no position in any of the stocks mentioned. The Motley Fool has positions in and recommends Berkshire Hathaway. The Motley Fool has a disclosure policy.
Recommended Articles


