


If a Bear Market Is Coming, Is VOO or VTI the Safer Investment?
Key Points
The S&P 500 tracks the 500 largest U.S. stocks on the market, while VTI holds virtually all U.S. stocks.
The S&P 500 and VTI share many top holdings, but the S&P 500 is more concentrated.
- 10 stocks we like better than Vanguard Morningstar Total Stock Market ETF ›
When talking about bear markets, it's a matter of when, not if. Because of that, it's never too early for investors to prepare accordingly.
The goal isn't a bear-market-proof portfolio (that's virtually impossible), but rather a foundation that helps you weather the storm. Between the popular Vanguard S&P 500 ETF (NYSEMKT: VOO) and the broader Vanguard Morningstar Total Stock Market ETF (NYSEMKT: VTI), which is better suited to ride out a bear market? Let's take a look.
Missed Nvidia in 2009? This Rare Signal Is Flashing Again. In 2009, a "Double Down" signal flashed for a little-known chipmaker called Nvidia. For the first time in years, that same "Total Conviction" signal is flashing for a company 1/100th the size of Nvidia. Continue »

Image source: Getty Images.
Where both ETFs stand out
VOO mirrors the S&P 500, which tracks the 500 largest U.S. companies on the American stock market. It's by far the most popular index in the stock market. VTI, on the other hand, holds almost every U.S. stock trading on the market. Both are weighted by market cap, so most of the holdings are large caps, though VTI also includes roughly 5.9% in small- and mid-cap stocks.
In the past few years, both VOO and VTI have become very top-heavy, with the top 10 holdings making up 37.63% and 33.19% of the ETFs, respectively.
| Company | VOO | VTI |
|---|---|---|
| Nvidia | 7.55% | 6.39% |
| Apple | 7.05% | 6.28% |
| Microsoft | 5.36% | 4.78% |
| Amazon | 4.13% | 3.64% |
| Alphabet (Class A) | 3.24% | 2.89% |
| Broadcom | 2.86% | 2.55% |
| Alphabet (Class C) | 2.62% | 2.31% |
| Meta Platforms | 1.90% | 1.69% |
| JPMorgan Chase | 1.46% | 1.31% |
| Berkshire Hathaway (Class B) | 1.46% | 1.27% |
| Eli Lilly | 1.41% | 1.35% |
Data source: Vanguard. Eli Lilly is VOO's 12th-largest holding; Berkshire (Class B) is VTI's 12th-largest. Percentages as of July 31, 2026.
This difference in makeup is both an advantage and a disadvantage for both. VOO's higher concentration in top holdings works out in its favor when big tech (like the "Magnificent Seven" stocks) is performing well. VTI's diversification prreducesoncentration risk.
Which is the better option?
In a bear market, I would lean toward VTI over VOO because of its diversification. In both cases, large-cap stocks are leading the way, but VTI's small exposure to small-cap and mid-cap stocks gives it exposure to unique growth opportunities that those companies have post-bear market.
Smaller companies often experience sharper drops during bear markets because they're more sensitive to broader economic conditions (though not all bear markets are economy-related). However, they've often outperformed during market recoveries.
A good example is the couple of years after the COVID-19 market crash. From March 23, 2020, when the S&P 500 hit its trough, both the Russell 2000 and the S&P 400 -- the primary indexes for small-cap and mid-cap stocks, respectively -- outperformed the S&P 500 by a substantial margin.
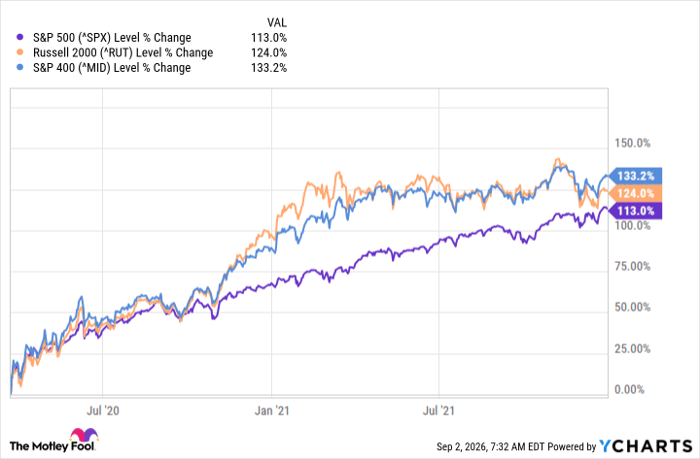
^SPX data by YCharts
VTI provides sufficient exposure to S&P 500 companies to benefit from their reliability and consistency, while also allowing investors to take advantage of the rebound potential of smaller stocks.
The key, though this is easier said than done, is to continue investing through a bear market and trust the long-term trajectory of the broader market.
Should you buy stock in Vanguard Morningstar Total Stock Market ETF right now?
Before you buy stock in Vanguard Morningstar Total Stock Market ETF, consider this:
The Motley Fool Stock Advisor analyst team just identified what they believe are the 10 best stocks for investors to buy now… and Vanguard Morningstar Total Stock Market ETF wasn’t one of them. The 10 stocks that made the cut could produce monster returns in the coming years.
Consider when Netflix made this list on December 17, 2004... if you invested $1,000 at the time of our recommendation, you’d have $445,833!* Or when Nvidia made this list on April 15, 2005... if you invested $1,000 at the time of our recommendation, you’d have $1,402,153!*
Now, it’s worth noting Stock Advisor’s total average return is 993% — a market-crushing outperformance compared to 214% for the S&P 500. Don't miss the latest top 10 list, available with Stock Advisor, and join an investing community built by individual investors for individual investors.
See the 10 stocks »
*Stock Advisor returns as of September 4, 2026.
JPMorgan Chase is an advertising partner of Motley Fool Money. Stefon Walters has positions in Apple, Microsoft, and Vanguard S&P 500 ETF. The Motley Fool has positions in and recommends Alphabet, Amazon, Apple, Berkshire Hathaway, Broadcom, Eli Lilly, JPMorgan Chase, Meta Platforms, Microsoft, Nvidia, and Vanguard S&P 500 ETF. The Motley Fool has a disclosure policy.
Recommended Articles


