


Netflix No Longer Relies on You Watching Longer, But on Making More Per Hour
Watch Time Rose Just 2% as Revenue Surged Nearly 15%: Is This High-Quality Growth in Maturity or the Last Stretch of Price-Hike Dividends?
Source: TradingView
In the first half of this year, Netflix delivered two numbers that do not quite match: combined revenue for the first two quarters was approximately $24.81 billion, up 14.7% year-over-year; during the same period, member viewing exceeded 97 billion hours, but grew by only 2%.
A rough calculation dividing total revenue by total viewing hours shows that Netflix's "revenue per hour" increased by about 12.5%. Users didn't watch much more than last year, but the money Netflix collected from every hour of viewing increased noticeably.
The term "earning" in the title refers to revenue, not profit; nor is "revenue per hour" an official metric of Netflix. It is simultaneously affected by subscriber growth, price hikes, advertising, plan mix, regional structure, and exchange rates. However, this contrast captures the most important question when analyzing Netflix today: the company is becoming increasingly adept at turning viewing into revenue, yet viewing itself no longer shows significant growth. Is this high-quality monetization in a mature phase, or is it depleting future pricing power ahead of time?
Understanding Netflix in One Minute
Netflix's business is not complicated: it charges households a monthly fee to provide series, movies, animation, and live streaming; members who choose lower-priced plans will see ads.
The company's largest investment is original and licensed content, while its greatest economic advantage is global scale. The same title can spread its costs across more than 325 million paid membership accounts without needing to reproduce content for each additional member.
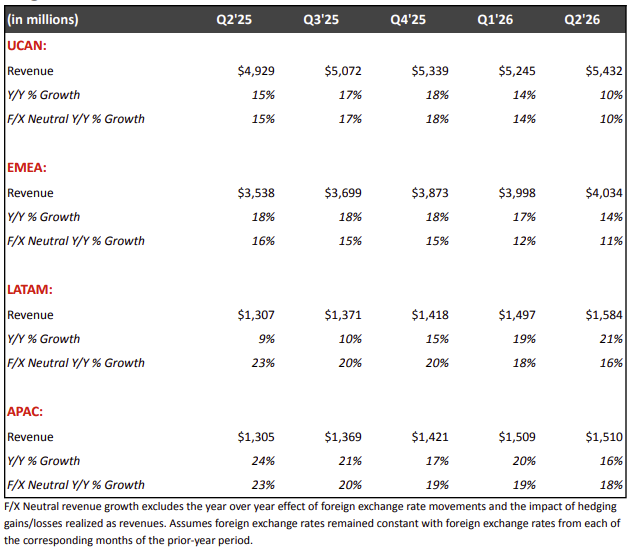
Netflix has also long been more than just a North American business. In the second quarter of 2026, the United States and Canada accounted for only about 43% of the company's revenue, while nearly 57% came from Europe, the Middle East, Africa, Latin America, and the Asia-Pacific region. North America remains one of the most mature markets, while overseas markets have become the primary driver of revenue expansion.
Source: Netflix
Yet in North America, Netflix is indeed more than just an app. It has become one of the default choices for home entertainment. This habit does not appear directly on the balance sheet, but it is reflected in retention, pricing power, and advertiser demand.
Netflix Has Changed Its Growth Formula
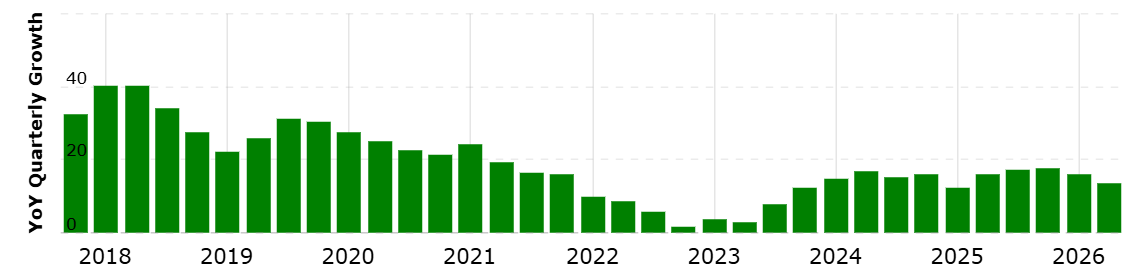
In the past, when analyzing Netflix, the first thing investors looked for was how many subscribers were added each quarter. Today, that figure has moved backstage, and the trend of slowing revenue growth is becoming increasingly clear.
Source: macrotrends
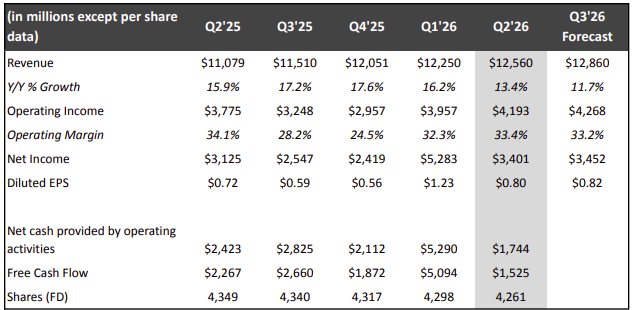
In 2025, Netflix's revenue grew by 16%, its operating margin rose from 26.7% to 29.5%, and paid memberships surpassed 325 million. For 2026, the company expects revenue to grow by 13% to 14%, operating margin to rise to 31.5%, and full-year operating profit to grow by more than 20%. Second-quarter revenue grew by 13.4%, and third-quarter guidance slowed further to 11.7%. This is not a recession. Netflix is simply stepping out of rapid user expansion into a mature growth stage: revenue growth is stepping down, but profits are still growing faster.
Source: Netflix
The issue is that starting in 2025, Netflix stopped disclosing full subscriber numbers and ARM (average revenue per membership) on a quarterly basis, updating subscriber metrics only when crossing major milestones. The company wants the market to focus on revenue and profit, but it makes it harder for external investors to break down whether growth comes from subscribers, pricing, or advertising.
The 12.5% Gap: What Happened to the Numerator and Denominator?
The 12.5% calculated earlier refers to the year-over-year increase in Netflix's "revenue per hour" in the first half of this year. To understand whether this number is good or bad, "revenue / viewing hours" can be roughly broken down into "revenue per member / viewing hours per member." Therefore, an increase in revenue per hour has two possible causes: each member generates more revenue, or each member watches less. The former represents efficiency, while the latter could be a red flag.
Let's first look at the revenue side. Netflix stated that after raising prices in markets such as the United States, Mexico, and Spain in the first half of this year, user reactions were broadly consistent with previous rounds, with no noticeable decline in price acceptance. Advertising grew even faster. The company expects advertising revenue in 2026 to reach approximately $3 billion, doubling from last year; in the first quarter, in countries where ad-supported plans were available, over 60% of new sign-ups chose the ad-supported option.
However, $3 billion represents only about 6% of full-year revenue. Moreover, revenue per member for ad-supported plans remains lower than that for standard ad-free plans, though the gap is narrowing. While advertising is already an effective monetization curve, it is not yet enough to re-accelerate the entire company.
Now let's look at the viewing side. Netflix's content has long extended beyond series and movies to include children's animation, licensed shows, live streams, and video podcasts. Different types of content perform different jobs. Management gave a good example: live streaming is expected to account for about 5% of this year's content budget and contribute only about 1% of viewing hours, yet it drove six of the top ten net membership addition peak days over the past five years; children and family animation similarly accounts for about 5% of the budget, but contributes about 8% of viewing hours. Live streaming drives new customer acquisition, advertising, and buzz, while kids' content excels at retention.
Therefore, I agree with the first half of what management said: not all viewing hours are created equal. Evaluating content solely on "how many hours are generated per $1 spent" would underestimate the commercial value of live streaming. However, this should not be a justification for reduced disclosure. Netflix has not disclosed the algorithm for its internal "high-quality engagement" metrics and changed "What We Watched" from biannual to annual release. Investors will find it harder to determine whether weakening per-capita viewing is due to a shift in content mix or because users are actually opening Netflix less often.
Even more paradoxically, the more important advertising becomes, the more important viewing hours should be. Under a pure subscription model, watching an extra hour does not necessarily increase revenue immediately; under an advertising model, an extra hour means more ad inventory to sell. Netflix cannot expect advertising to be a growth engine while simultaneously downplaying viewing hours.
How Does Revenue Turn into a 31.5% Profit Margin?
Netflix expects its operating margin to rise from 29.5% to 31.5% this year, while content amortization is expected to grow by about 10%, lower than the revenue growth of 13% to 14%.
Content costs are not fully expensed at once when a title launches; instead, they are amortized over several years according to expected viewing patterns. When revenue growth outpaces content amortization, the same dollar of content cost is spread across more members, more markets, and higher revenue, leaving a larger proportion of incremental revenue to become operating profit.
This is Netflix's scale effect. A high profit margin is not the moat itself, but rather the cumulative result of global content cost sharing, brand strength and pricing power, recommendation experience, and content allocation efficiency.
As a directional comparison, Disney's subscription streaming businesses, including Disney+ and Hulu, achieved a double-digit adjusted profit margin for the first time in the latest quarter. The two companies use different metrics, so they cannot be directly subtracted from Netflix's 31.5%, but Netflix's lead in profitability remains distinct.
A margin improvement can also come from cutting investments, so cash spend must also be examined. Netflix expects full-year cash content spending to be approximately 1.1 times content amortization, showing no obvious sign of "slashing content for profits" for now.
The impact of AI remains limited. Generative AI workflows have been used in about 300 titles, primarily concentrated in post-production; however, Netflix has not disclosed company-level cost savings or margin contributions. At this stage, AI is more of an efficiency tool than a standalone new business that can be valued separately.
Netflix Is Facing Not One Competition, But Four Wars
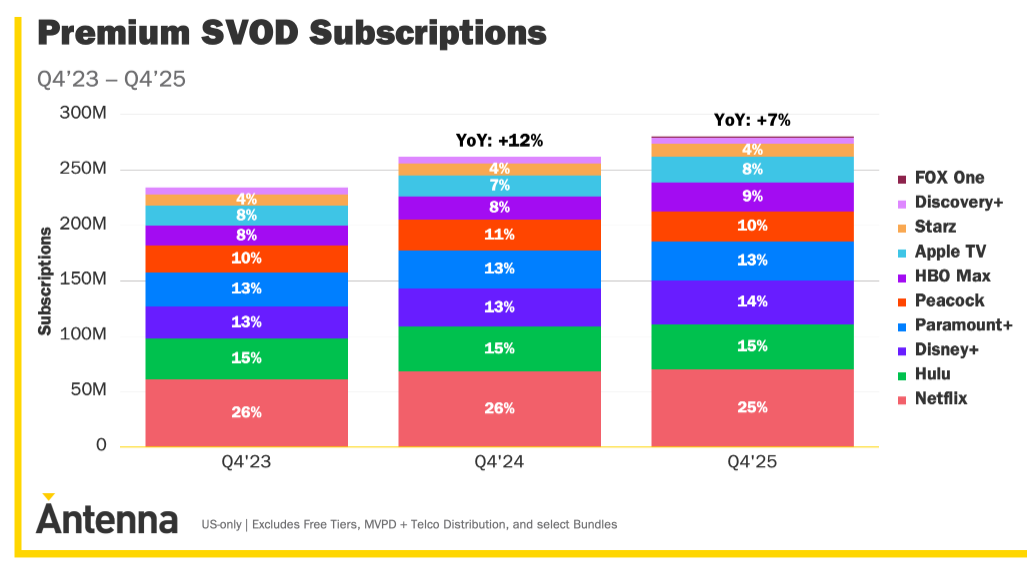
The first war is for subscription budgets. What Antenna refers to as Premium SVOD subscriptions can be simply understood as the total subscriptions of mainstream paid streaming services such as Netflix, Disney+, and Max. This looks at total subscriptions across services, not unique households. If a household subscribes to three platforms simultaneously, it is counted three times. In 2025, total U.S. Premium SVOD subscriptions grew by only 7%, down from 12% the previous year; the weighted average churn rate was 4.6%. This 4.6% can be simply understood as roughly 4.6% of subscription relationships being canceled each month when weighted by subscriber scale across platforms. Antenna's data shows that churn has stabilized compared to previous volatile periods.
This is not streaming falling out of favor, but rather the market entering a zero-sum, existing-user competition: most who are willing to pay are already on board, and platforms are now competing on who can retain users.
Source: Antenna
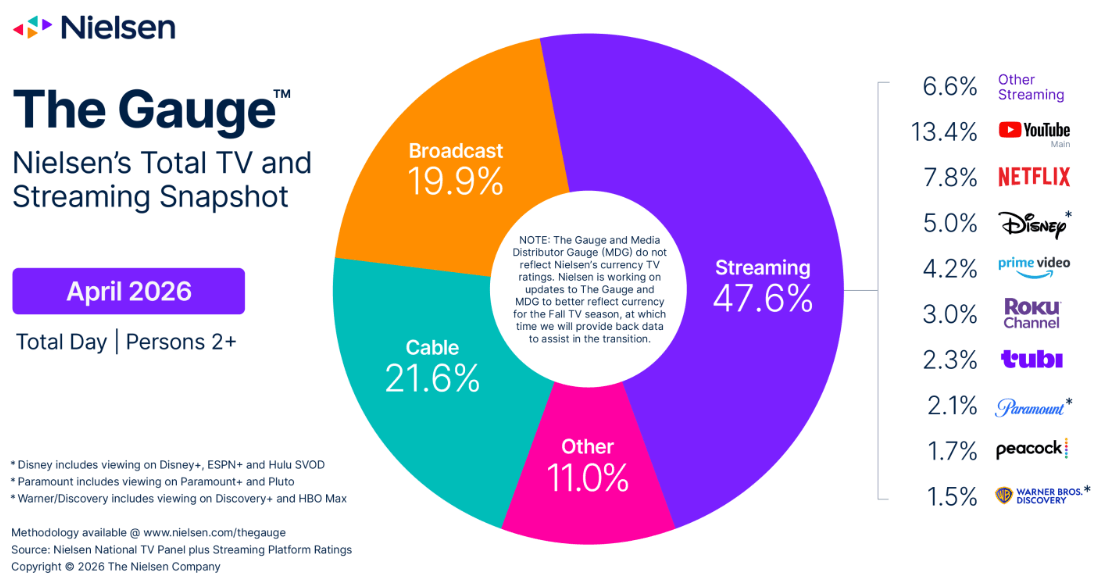
The second war is for the living room. By April 2026, streaming accounted for 47.6% of U.S. TV viewing time, with Netflix continuing to benefit from the migration from traditional TV to streaming; however, YouTube accounted for 13.4% of total TV viewing time, higher than Netflix's roughly 7.8%. Alphabet disclosed that U.S. viewers spend over 200 million hours per day watching YouTube in living rooms. YouTube is no longer just a short-video app on mobile phones; it has directly entered the big screens and evening time slots where Netflix holds its strongest advantage.
Source: Nielsen
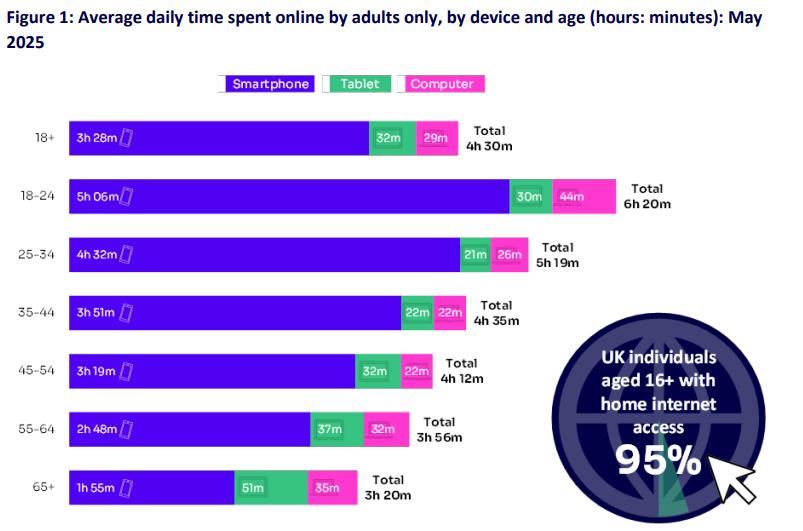
The third war is for daytime and mobile time. Using the UK as a directional reference, adults spent an average of 4 hours and 30 minutes online per day in 2025, reaching 6 hours and 20 minutes for those aged 18 to 24, with smartphones accounting for 77% of total online time. Users aged 18 to 34 spent an average of 88 minutes per day on YouTube and 49 minutes on TikTok. While not global data, it sufficiently illustrates the threat of short video: it does not need to fully replace a drama episode; simply causing consumers to open Netflix one fewer time during lunch, commutes, or before bed already constitutes competition.
Source: Ofcom
The fourth war is for ad budgets. The IAB projects that U.S. digital video ad spend will exceed $80 billion in 2026, growing by 11%, with social video growing by 13%—faster than connected TV's 11% for the first time. The market opportunity is vast, but Netflix remains a challenger: YouTube generated $9.9 billion in ad revenue in Q1 2026 alone, whereas Netflix's full-year ad revenue target is about $3 billion. While timeframes and product scopes differ between the two, preventing a direct comparison of profitability, the difference in magnitude clearly shows that Netflix is still playing catch-up in ad tech, precision targeting, attribution measurement, and automated trading.
Disney competes for IP and family users; Amazon relies on Prime bundling and sports; YouTube competes for living rooms, creators, and advertising; while TikTok and Instagram compete for fragmented time. Netflix's true competitors are all products that cause users to open Netflix one less time.
The Second Growth Curve Might Be a Second Prime Time
Advertising is currently Netflix's clearest new revenue source, but what deserves even more attention is whether the company can transform from an "app for evening binge-watching" into an all-day entertainment portal. About half of Netflix's viewing occurs in the evening; video podcasts have a higher proportion of viewing during the day and on mobile devices. The partnership with France's TF1 brings TV channels, on-demand programming, and select live broadcasts directly into Netflix, testing whether it can further become a distribution platform for third-party media.
What Netflix lacks may not necessarily be a completely different new business, but rather a second prime time outside of the evening: watching short content during commutes, listening to/watching video podcasts during the day, watching live streams at specific times, and adding kids' content and games in home settings. This direction is worth watching, but it remains a product direction rather than a proven second growth curve.
Valuation Returns to a Reasonable Range, But Still Far From Cheap
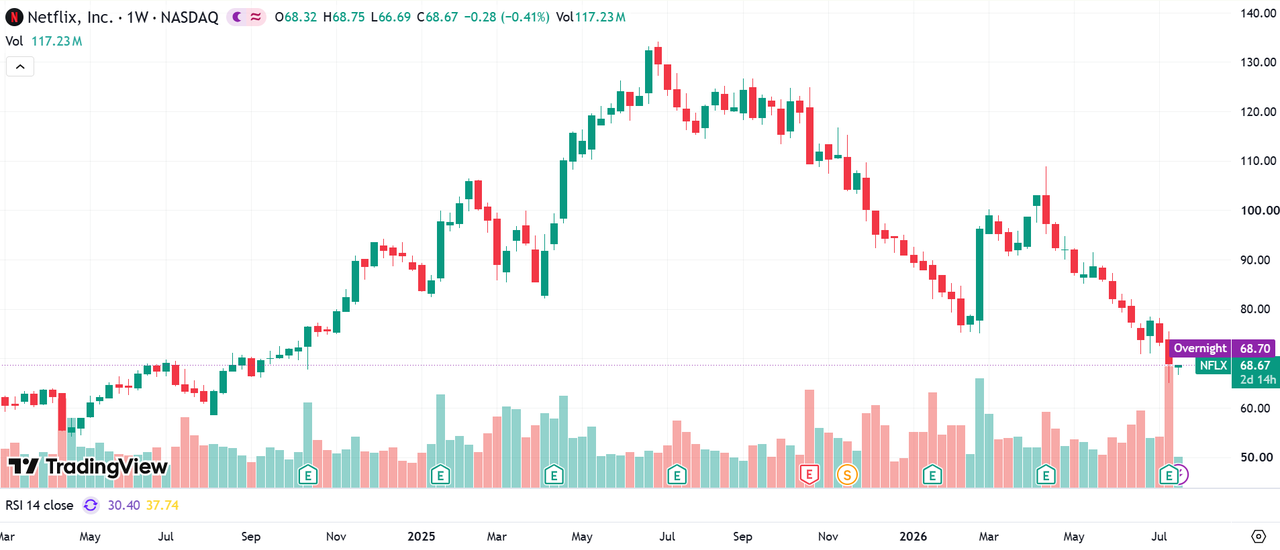
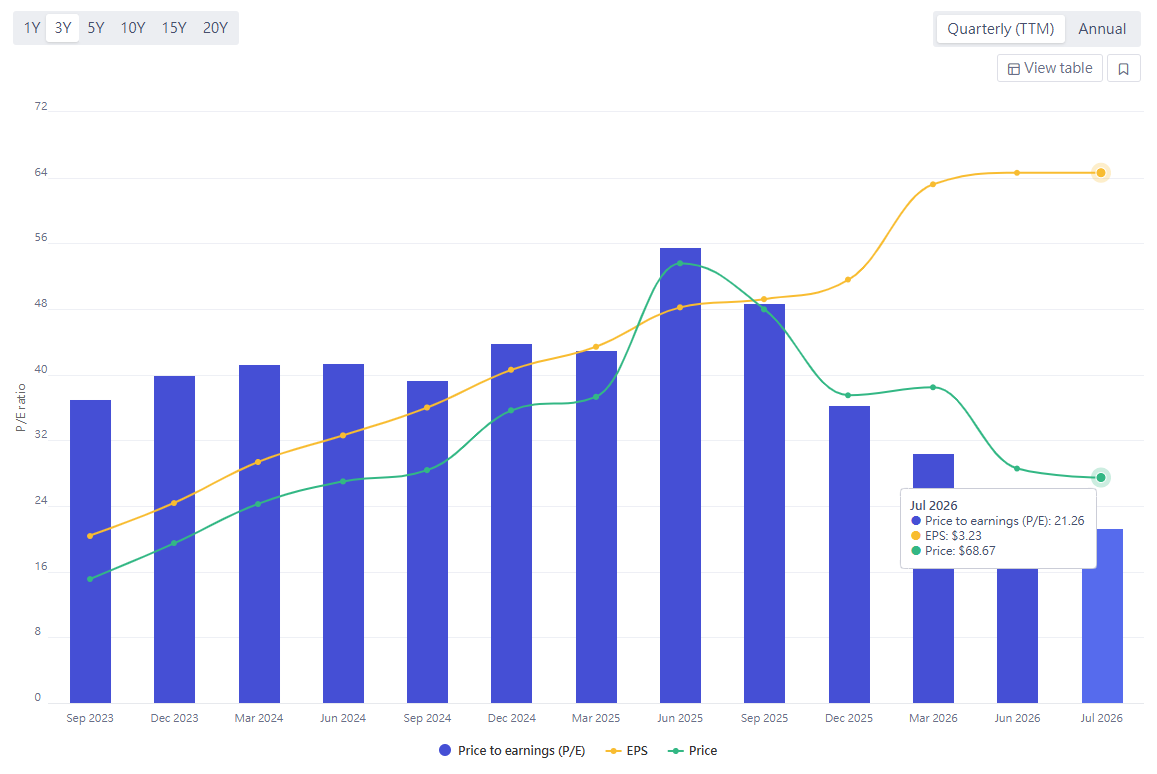
As of the close on August 4, 2026, Netflix's stock price stood at $73.57. Compared to its split-adjusted all-time high of $133.91 on June 30, 2025, the stock price has pulled back by about 45%.
A significant drop in stock price does not mean the stock is necessarily cheap. What really needs to be compared is whether Netflix's growth capability today can support its current price. At the stock price peak last year, Netflix traded at a forward P/E ratio of over 40x; it has now dropped to around 20x to 21x. The market is clearly no longer pricing it by the standards of a high-growth company. A valuation multiple contraction is not surprising. Over the past few years, Netflix simultaneously enjoyed the narrative scope brought by subscriber growth, paid sharing, price hikes, and advertising; today, revenue growth is shifting down to the low double digits, so the market naturally will not continue using high-growth-period multiples.
However, a forward P/E of 20x to 21x cannot be directly interpreted as cheap either. Netflix received a $2.8 billion termination fee from the Warner Bros. deal in the first quarter, a one-off gain that boosted current-period earnings and cash flow and will not recur next year. The company currently expects to generate $12.5 billion in free cash flow in 2026, but before receiving the termination fee, its original guidance was $11.0 billion. Based on its current market cap of approximately $306 billion, if using the $11.0 billion figure closer to core operations, Netflix trades at roughly 28x normalized free cash flow.
This is much more reasonable than at the peak, yet it still reflects a distinct premium for a high-quality company. Under my base case, the current price roughly requires Netflix to maintain 10% to 12% revenue growth, continue expanding margins, and sustain double-digit growth in free cash flow per share through buybacks. In the short term, the company remains above this baseline. Netflix projects 2026 revenue growth of 13% to 14%, an operating margin of 31.5%, and full-year operating profit growth exceeding 20%.
If future revenue growth drops to the high single digits and viewing per member continues to weaken, 28x free cash flow remains on the high side; only if advertising and new usage scenarios keep revenue growth above 13% will the current price appear more attractive. In the second quarter, Netflix repurchased $4.7 billion in stock, setting a single-quarter record. When valuation multiples no longer rise rapidly, earnings, cash flow, and share repurchases will take over as the main drivers of value growth per share. Therefore, Netflix has transitioned from "too expensive to afford mistakes" back to a range of "fairly valued, but still needing performance to prove itself."
Source: fullratio
Conclusion: High-Quality Maturity, or the Final Dividend of Price Hikes?
Netflix is no longer the company of the past that grew rapidly primarily by relying on net subscriber additions. Today, it relies more on price hikes, advertising, profit margins, and share repurchases to drive continued growth in value per share.
However, this premise holds a prerequisite: Netflix must maintain user viewing and consumption habits while increasing revenue per hour. If users gradually watch less and open the app less frequently, price hikes will hit a ceiling, and advertising will lose its most vital source of inventory.
Over the next two to three years, I believe the most critical change for Netflix will not be raising prices a few more times, but whether advertising can truly upgrade from a "monetization tool" to a growth engine, and whether the company can discover new usage scenarios beyond evening binge-watching. If these two things materialize, even if subscriber growth never returns to its past pace, Netflix still has a chance to maintain low-double-digit revenue growth and keep profit growth consistently faster than revenue.
Conversely, if viewing hours show long-term low-single-digit growth and revenue gradually slips below double digits, the market will ultimately be forced to revisit a harsher question: Is Netflix a global entertainment platform, or a mature media company with exceptionally strong profitability? The two identities command vastly different valuations.
My current assessment still leans toward the former. However, what Netflix needs to prove in the next stage is not just that it is better at collecting money, but that it can still maintain growth after reaching maturity.
Disclaimer: The analysis in this article represents a research framework based solely on currently available public information and does not constitute any investment advice.
Recommended Articles


