


Is It Really Safe to Invest in the S&P 500 Right Now? History Offers a Clear Answer.
Key Points
The S&P 500 and stocks, in general, are near record valuations.
Historically, such frothy valuations have led to steep sell-offs.
However, investing in the S&P 500 has paid off over the long run.
- 10 stocks we like better than S&P 500 Index ›
We're seeing the investing adage "stocks climb a wall of worry" play out before our eyes. The S&P 500 (SNPINDEX: ^GSPC) is near its all-time high. However, consumer sentiment is near a record low. Inflation is rising. The odds are high that the Fed will be forced to raise rates over the next few months.
Is it really safe to invest in the S&P 500 right now? History offers a clear answer.
Missed Nvidia in 2009? This Rare Signal Is Flashing Again. In 2009, a "Double Down" signal flashed for a little-known chipmaker called Nvidia. For the first time in years, that same "Total Conviction" signal is flashing for a company 1/100th the size of Nvidia. Continue »

Image source: Getty Images.
Warning signs from the past
The S&P 500 Shiller CAPE (cyclically adjusted price-to-earnings) ratio is one of the best market valuation metrics. This ratio currently stands at 41.4, according to YCharts. The last time the S&P 500 Shiller CAPE ratio was higher was in 2000.
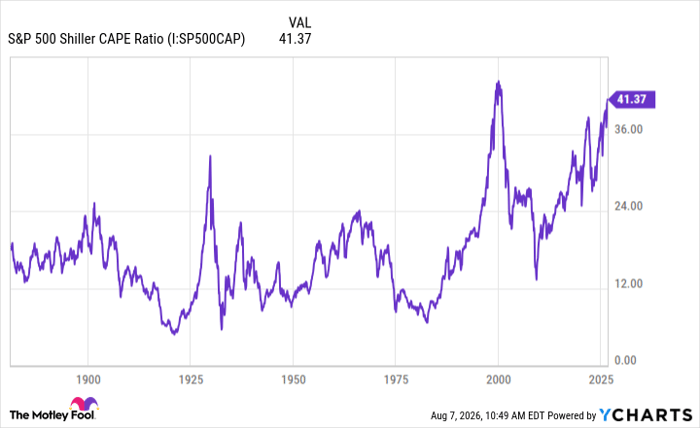
S&P 500 Shiller CAPE Ratio data by YCharts
Investors who know their history probably remember what happened 26 years ago. The dot-com bubble burst, with the S&P 500 eventually sinking by nearly 50%.
Economist and Nobel laureate Robert Shiller, who designed the CAPE ratio, analyzed historical stock market data. He found that every time the CAPE has topped 30, real returns over the next 10 years have been below the historical average.
There's also another valuation yellow flag waving that investors shouldn't ignore. Warren Buffett popularized a metric that was eventually called "the Buffett indicator." This metric measures the ratio of total stock market capitalization to U.S. GDP.
Buffett stated in 2001 that anytime the ratio approaches 200%, investors are "playing with fire." He has been proven right in the past. The Buffett indicator rose nearly that high in 1999 and early 2000 -- and the stock market soon tanked. It topped 190% in late 2021. The S&P 500 fell 19% the next year.
Where does the Buffett indicator stand today? At 232% -- its all-time high. If Buffett is still right, investors are playing with fire yet again.
A rosier, longer-term lesson
However, history provides a rosier lesson over the longer term. The S&P 500 has generated a positive return 94% of the time over any 10 years. And over 20-year periods, the index has always delivered positive returns.
Suppose you invested $10,000 in the SPDR S&P 500 ETF Trust (NYSEMKT: SPY) at the market peak on March 24, 2000. Horrible timing, right? The market plunged shortly afterward. If you sold in a panic, you would have lost a lot of money.
But if you held on, it's a different story. That initial investment of $10,000 would be worth more than $80,000 if the dividends were reinvested.
History's clear answer(s)
So is it really safe to invest in the S&P 500 right now? History doesn't give just one clear answer; it provides two -- and which one is applicable for you depends on your investing time horizon.
If you will need your money over the next two or three years, investing in the S&P 500 right now could be a mistake. To be sure, the stock market could continue to rise for a while. Neither the CAPE ratio nor the Buffett indicator is great at market timing. But valuations are frothy, and that usually leads to a significant downturn.
On the other hand, if you have the patience to buy and hold for 10 or 20 years (or more), investing in the S&P 500 right now shouldn't be concerning. The best way to do so is usually to buy shares of a low-cost S&P 500 exchange-traded fund (ETF) over time. This approach, called dollar-cost averaging, allows you to buy at times when the S&P 500 is higher and at other times when it's lower. Over time, the end result has consistently led to attractive returns.
Should you buy stock in S&P 500 Index right now?
Before you buy stock in S&P 500 Index, consider this:
The Motley Fool Stock Advisor analyst team just identified what they believe are the 10 best stocks for investors to buy now… and S&P 500 Index wasn’t one of them. The 10 stocks that made the cut could produce monster returns in the coming years.
Consider when Netflix made this list on December 17, 2004... if you invested $1,000 at the time of our recommendation, you’d have $399,832!* Or when Nvidia made this list on April 15, 2005... if you invested $1,000 at the time of our recommendation, you’d have $1,374,595!*
Now, it’s worth noting Stock Advisor’s total average return is 968% — a market-crushing outperformance compared to 215% for the S&P 500. Don't miss the latest top 10 list, available with Stock Advisor, and join an investing community built by individual investors for individual investors.
See the 10 stocks »
*Stock Advisor returns as of August 10, 2026.
Keith Speights has no position in any of the stocks mentioned. The Motley Fool has no position in any of the stocks mentioned. The Motley Fool has a disclosure policy.
Recommended Articles


